

Appendix G - Research on Vehicle Stability and Driver Behavior
Recent Vehicular Stability Studies
A study by the University of New South Wales for the State Emergency Services Department (Smith, Modra, et al., 2017) [?] summarized most of the available research on vehicular stability in flowing water. In addition, they added new research on two prototype vehicle stability limit tests where most of the previous work had been scale models. This report represents the state of the art in vehicle stability research. Figure shows a summary of most available stability threshold data in one chart.
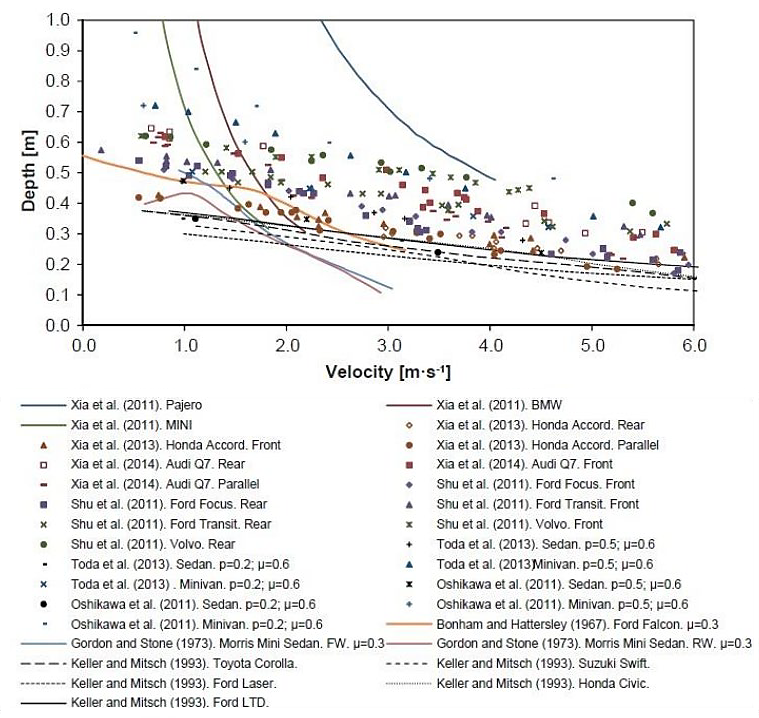
In the study, a small passenger car and a four-wheel drive sport utility vehicle (4WD SUV) were placed in a large pool and pulled sideways until they moved. There was no velocity in the water, but it was inferred based on the force required to move the vehicle from rest. The static coefficient of friction was measured at 0.78 for both vehicles for the tires against wet concrete. This is larger than the assumed coefficient in flood conditions for a moving car (0.30). The lower 0.30 is cited by multiple sources as a reasonable, conservative assumption. Many environmental and conditional factors impact this coefficient including the tires, supporting material (asphalt, gravel, concrete, etc.), and temperature. The vehicle loses stability when the friction force equals the hydrodynamic force applied by the flowing water.
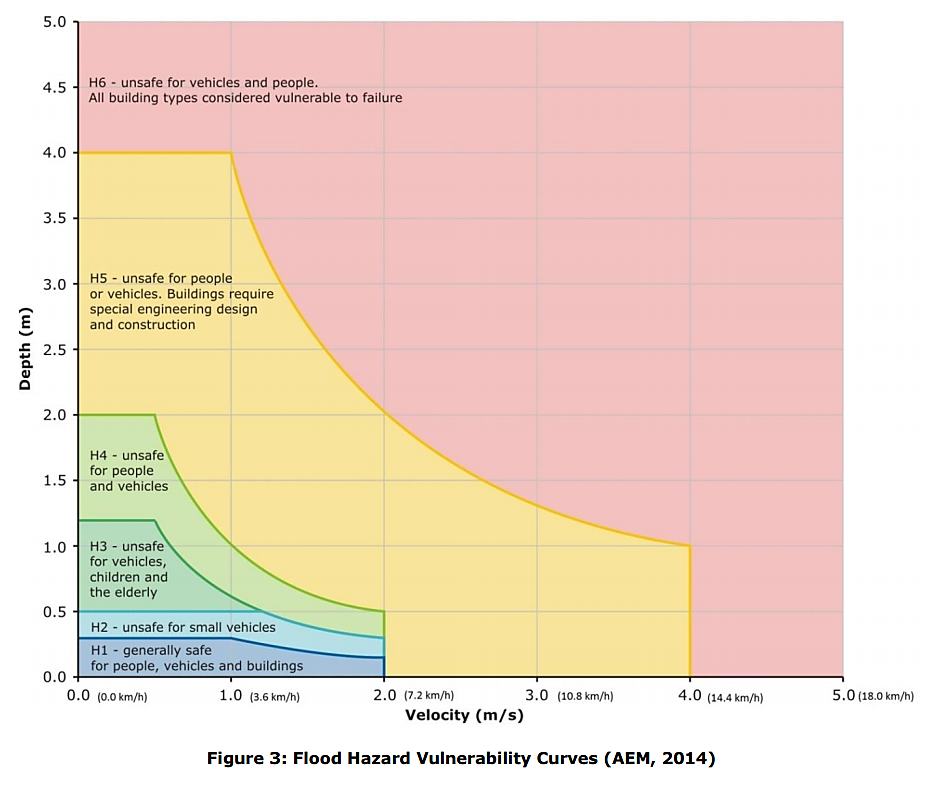
Parsing all of the available data and new results, the study developed stability thresholds called Flood Hazard Vulnerability Curves and shown in Figure. The thresholds are intended to be conservative and used for roadway design such that if cars enter the flooded roadway they will not be swept away. These limits represent a reasonable lower bound of vehicle stability for LifeSim purposes.
In Figure, the H1-H2 threshold curve represents the lower limit for small vehicles and H2-H3 the lower limit for taller vehicles.
Arrighi et al. explore the incipient motion of vehicles with three-dimensional (3D) numerical modeling of flow and accurate vehicle weight and dimensions (Arrighi, Alcerrecha-Huerta et al., 2015 [?] and Arrighi, Huybrechts et al., 2016 [?]). They introduce a Shields-type mobility parameter and show its dependence on the Froude number using results of other model tests. The 3D modeling reinforced the importance of the coefficient of friction to hold the vehicle in place. It also showed dependence on the Froude number of the lift and drag coefficients of the vehicle. This research has not been incorporated into LifeSim. For further detail, refer to the journal articles.
Recent Driver Behavior Studies
The following describes the body of research and logic used to construct the willingness to enter flooded roads curves in LifeSim. It relies primarily on four studies of driver behavior when confronted with flooded roads: Gissing et al. (2016) [?], Drobot et al. (2007) [?], Pearson and Hamilton (2014) [?], and Hamilton et al. (2016) [?]. How the resulting data and probability curves were incorporated into LifeSim is summarized in Evacuation Parameters Defined by Alternative.
Some of the research suggests factors that can increase a person's likelihood to enter flooded roads include:
- Gender: Male (especially at lower depths)
- Age: 18-35 years old
- Prior experience with floods and driving in floods
- Perception of societal norms (are people generally okay with driving in floods?)
- Risk-taking attitude
- Poor reception to flood warnings
- Lack of warning information / signage
- Feeling of control of the circumstances
- Low velocities (perception of flood water flow velocity)
- Lack of females or dependent passengers in the vehicle
Gissing and Haynes (Gissing et al., 2016) [?] conducted the only known research to observe driver behavior at a flooded road. The road was flooded about 10–30 centimeters (cm) and moving "slowly." They observed 154 drivers and noted gender, relative age, and vehicle type as they were able but not in all cases. Some drivers were influenced by the actions of other drivers either to enter or turn around. Four-wheel drive (4WD) vehicles were more willing to enter a flooded roadway than smaller vehicles. Males were also more likely than females to drive into the water.
Overall, 84% of the drivers entered the flooded road. Segregating the data into high-clearance, low-clearance, and unknown (92%, 71%, and 82% entering, respectively), trends emerge that people in larger vehicles are more willing to enter a flooded road.
Drobot, Benight, and Gruntfest (Drobot et al., 2007) [?] surveyed about 900 people by mail in Denver, Colorado and Austin, Texas. They asked people to report their answers on a 4-point scale from "strongly agree" to "strongly disagree." Three questions were posed after the following scenario was presented:
You are driving a mid-sized car immediately after a severe thunderstorm in your city. Ahead of you approximately 18 inches (46 cm) of water covers the road and vehicles ahead are stopped.
- If traffic started to move, I would attempt to cross the water.
- Regardless of my vehicle, if water were covering most of the tires on the truck in front of me, I would attempt to drive through the water.
- If I were driving an SUV, truck or 4WD instead of a car, I would attempt to drive through the water.
Based on answers to the 3 questions, drivers were categorized as willing to drive through flooded roads or not. Overall, 40% of respondents in Denver indicated they would enter the flooded road, while 8% of respondents in Austin would.
Important factors in determining whether respondents will drive into flooded roads include: whether or not they take flash flood warnings seriously, their age, their knowledge of the danger of flash floods and vehicles, and in Denver, previous experience with floods. Gender did not have a statistically significant trend.
These two points were deemed to be low estimates based on these factors:
- They were told that cars ahead had stopped, which is liable to bias the drivers to follow suit. Seeing another vehicle pass through makes a driver more likely to follow.
- The depth of flooding was given by the survey. Anecdotal evidence suggests that people are not good judges of hazardous conditions, especially if the water is cloudy or has significant velocity.
- Results indicate that if people were in a high clearance vehicle instead of the "mid-sized car," they would be more likely to enter the road.
In another study (Pearson and Hamilton, 2014 [?] and Hamilton et al., 2016 [?]), a scenario prompt was adopted from Drobot et al., 2007 [?]:
You are driving in a mid-size car immediately after a thunderstorm. You approach a section of the road that is completely covered in 20 cm (or 60 cm) of water.
For the 20 cm scenario, a mean of 3.6 indicated that, on average, 43% of people would enter the flooded road. For 60 cm, the mean was 1.79 or 13%. This assumes the range is 0 to 100% for responses 1 to 7, respectively.
It is generally not appropriate to calculate a mean of Likert scale responses or to convert that mean to a representative percentage of respondents. A scale of subjective responses ("strongly agree" to "strongly disagree") is not likely to be accurately represented by a continuous number line. Unfortunately, as seen from this discussion, very little information on this subject was available, so the points were developed and added to the plots to help inform the final curve development. However, they should be considered in their proper context.
These seven points represent the best data available. Unfortunately, they do not provide enough data to fit a curve. In Figure and Figure, these points and their uncertainty bands are plotted with data pulled from the vehicle stability analysis (Road Networks, Destinations, and Evacuation Parameters). The gray curves represent the spread of data on vehicle stability at certain velocities. The y-axis then represents the % of vehicles in the dataset that would maintain stability encompassing variations in vehicle height, weight, cargo, road conditions, tire conditions, etc. The best estimate of vehicle stability represents where 50% of vehicles are stable while the upper and lower stability thresholds represent 0% and 100% of vehicles, respectively.
Since most data points are for cars, the low clearance curve was drawn first. Most confidence was given to the cars observed in Gissing et al., because it was actual behavior and not self-reported, expected behavior. A 10% range was added to the Drobot et al. points to account for the scenario description where cars have stopped in front of you, which has been shown to impact the decision to enter.
The curve was then generally fit through the points following a normal distribution curve. The high clearance vehicle curve adopted the standard deviation (slope) of the low clearance curve and was then drawn through the one point belonging to it. It is slightly deeper than all the car points but also considered anecdotal evidence from video and reports of vehicles entering flooded roads.
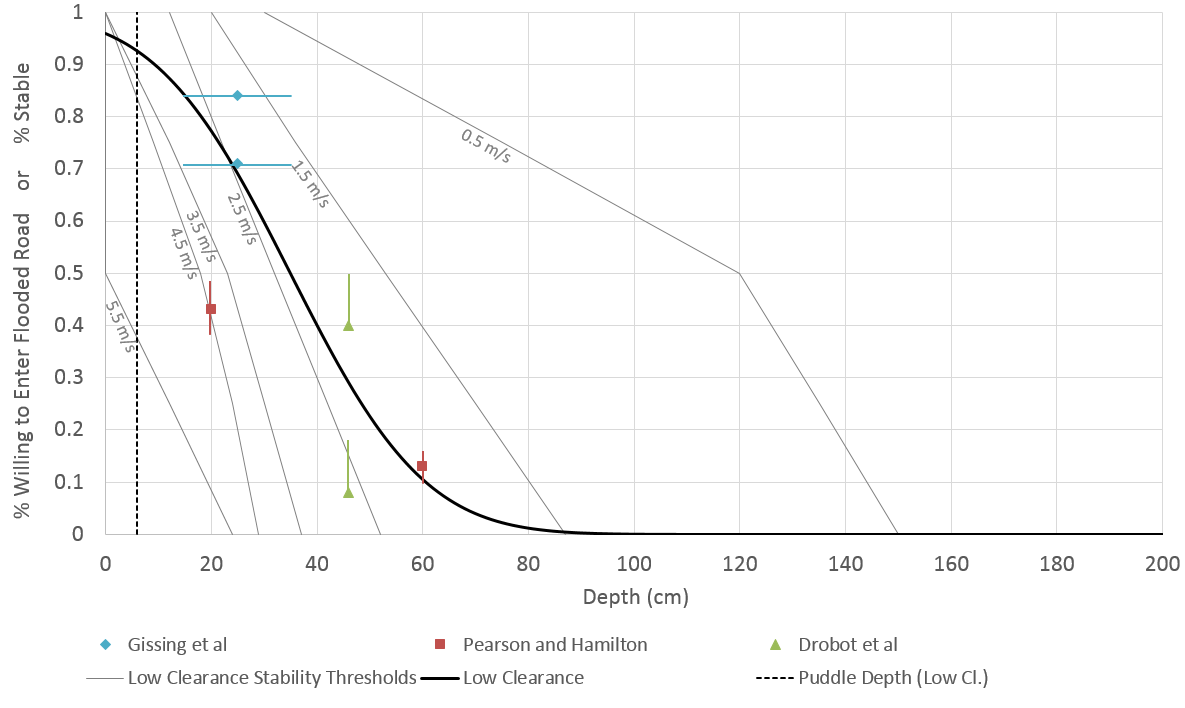
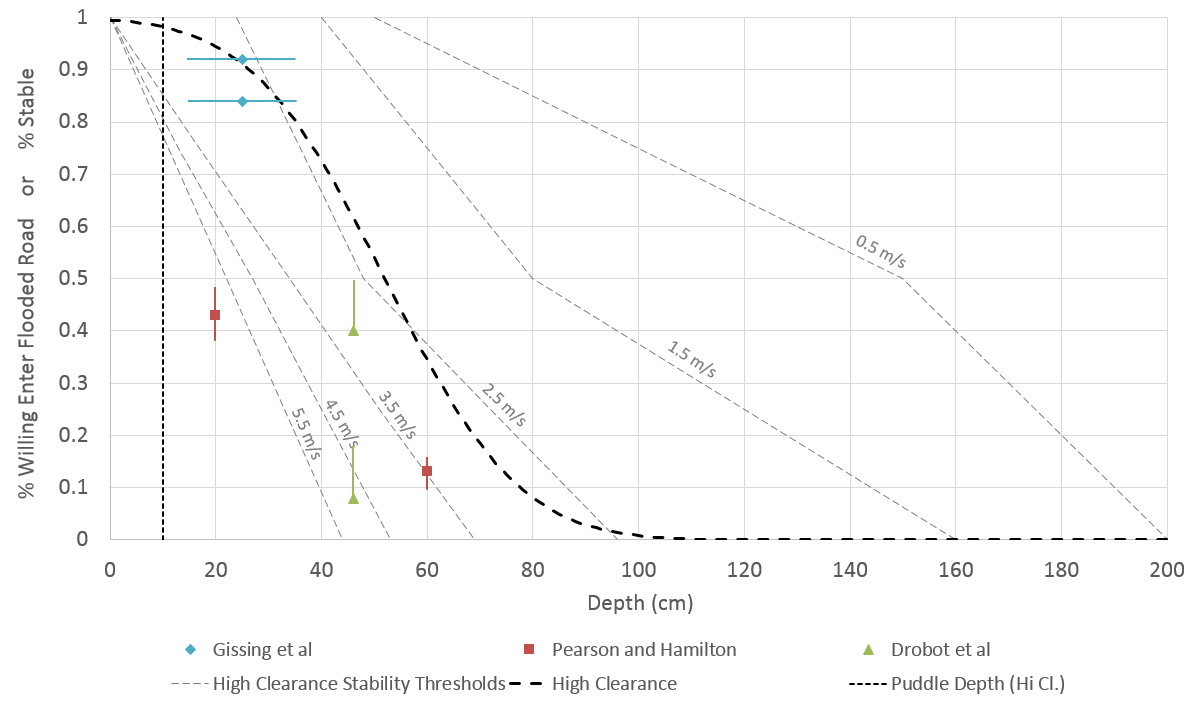
Each curve is defined by a mean, standard deviation, and puddle depth which all vehicles will drive through, as shown in Table.
| Low Clearance | High Clearance | |
|---|---|---|
| Mean (cm) | 35 | 52 |
| Standard Deviation (cm) | 20 | 20 |
| Puddle Depth (cm) | 6 | 10 |
Many factors contribute to the decision-making process when a driver approaches a flooded road. Most of those factors are not knowable and pertain to the particular circumstances and perception of the driver.
Specifically, is the driver:
- Willing to risk their life to reach a family member?
- Accurately able to judge the conditions and the stability of their own vehicle?
- Risk averse?
In place of this complex set of factors, we can model depth and velocity of the water. In literature, the hazard has been represented almost exclusively with depth only, and anecdotally, it seems people are a better judge of depth than velocity. Considering all the research and limitations of modeling, the decision criteria in LifeSim will be a function of depth only.
Several other distributions were considered to define the willingness curves including Uniform, Gamma, Gumbel, Pearson Type 3, and a modified normal. Some of these offered advantages over the selected truncated normal distribution, but none represented the data adequately while also being easy to understand by most users. The uniform distribution would only require a minimum and maximum depth, making it easy to comprehend but poorly representing both a central tendency of most people and the possibility of more extreme behavior. In fact, it is likely that more extreme risk-taking behavior will account for a significant amount of the life loss on roads. A problem with the normal distribution is that negative depths are possible. Adding a puddle depth, below which the normal distribution is ignored, solves this problem while also being an easy to understand minimum.
A cursory review of the proposed default curves shows a couple noteworthy points. For low clearance vehicles, 100% will enter 2.5 inches (6 cm) of water regardless of velocity, 58% will enter 1 foot (30 cm), 9% will enter 2 feet (61 cm), and none will enter more than 3 feet (91 cm). For high clearance vehicles, 100% will enter 4 inches (10 cm) of water regardless of velocity, 86% will enter 1 foot (30 cm), 33% will enter 2 feet (61 cm), and none will enter more than 3.5 feet (107 cm). A comparison to the stability curves – representing behavior with perfect knowledge of the risk – reveals that all vehicles will avoid deep, slow water that would not cause them to lose stability but may have induced floating or water inside the vehicle. Conversely, vehicles will be subjected to low depth, high velocity flows which have been shown to destabilize vehicles. These people will then be subject to the high hazard fatality curve.
The previous threshold was 2 feet for all vehicles. By making these changes, we are recognizing the complexity and uncertainty of the decision-making process and the difference between high and low clearance vehicles. The method does not allow for decisions based on perception of the velocity of the water which is a significant limitation but was not supported by the available data. The changes result in less vehicles entering a road flooded at 2 feet of depth, but also allow some to enter deeper water, and some to turn around at lower depths. While the previous 2-foot threshold had no research supporting it, the new threshold is supported as described above.