Appendix D - Excerpt from Protective Action Initiation Time Estimation for Dam Breaches, Controlled Dam Releases and Levee Breaches or Overtopping
The following is excerpted from an undated document produced for the USACE Risk Management Center by John H. Sorensen and Dennis S. Mileti titled Protective Action Initiation Time Estimation for Dam Breaches, Controlled Dam Releases and Levee Breaches or Overtopping, pp. 21-26.
Point Estimates and Curves for Discrete Events
Pittsburgh and Confluence Mobilization (PAI) Curves
On Saturday, April 11, 1987 at 12:29 PM, a westbound Conrail freight train derailed in Pittsburgh, Pennsylvania. In the process of derailing, the westbound train sideswiped an eastbound train causing it to derail. Four tank cars containing hazardous materials on the eastbound train were derailed. Sparks resulting from the accident ignited a fire. Because of the involvement of hazardous materials, Pittsburgh emergency personnel initiated an evacuation upon arrival at the scene about 20 minutes after the accident. Apparently recognizing signs of potential danger, some local residents in the immediate adjacent areas had already begun to evacuate. Up to 22,000 people were evacuated as the initial evacuation area was expanded to accommodate changing weather conditions.
By 5:50 PM, the affected areas had been declared safe and the initial evacuation order was rescinded. Emergency officials planned a second precautionary evacuation for 1:00 PM the following day to upright the leaking tank car; however, a close inspection of the damaged tank car shortly after midnight detected continued deterioration of the tank car. At 1:30 AM, an evacuation order affecting between 14,000 and 16,000 residents within a half mile of the scene was issued. This second evacuation order was not rescinded until 4:30 PM on Sunday, April 12, 1987. Approximately 25 people were treated for eye and throat irritation at area hospitals, and three people were hospitalized during the course of the accident.
On Wednesday, May 6, 1987 at 4:10 AM, 21 of the 27 "empty" tank cars carrying product residues, including propane, chlorine, caustic soda, carbon disulfide, methyl chloride, chloroform, and isobutene derailed in Confluence, Pennsylvania. Because tank cars carrying residue can haul up to 3% of their full load, emergency officials had no way to determine the exact total amount of products remaining in the cars. Upon examination of the train's manifest, emergency management officials initiated a precautionary evacuation of the 986 residents. A 3-minute non-stop siren blast was sounded, which primarily alerted the volunteer firemen as residents could not be aware of the specific meaning of this siren-blast; although it could serve as an alert to those who heard it.
At approximately 4:30 AM, a door-to-door and portable loudspeaker alert and notification of the emergency began using volunteer firemen and un-trained volunteers. Public shelters were set up in the area's high school, and local school buses and ambulances provided transportation for those needing it. The researchers reported that officials indicated the evacuation was completed in 45 minutes. Assistance from area-wide emergency personnel sealed two leaking propane tankers by 9:48 AM, but the chance of explosion and/or fire during wreckage cleanup prevented return until 6:10 PM.
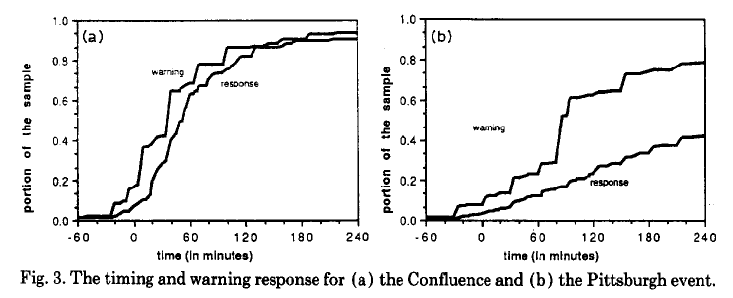
Rogers and Sorensen (1989) [?] describe the study methods and data collection. Using this data, the following curves were plotted for the two events (see Figure).
Nanticoke Mobilization (PAI) Curve
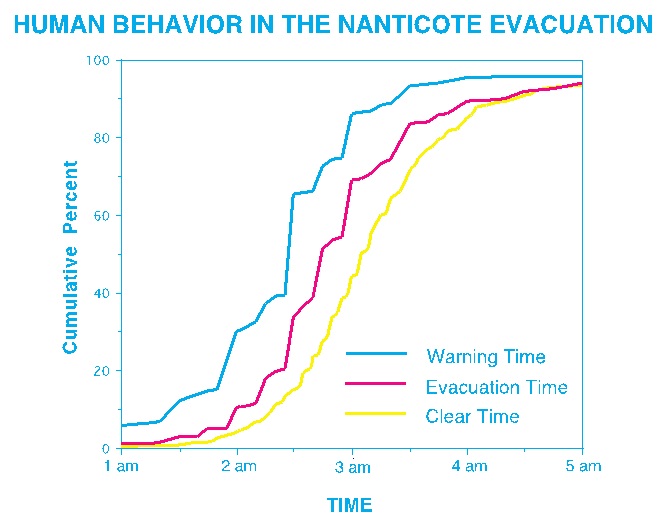
A fire that threatened to burn toxic chemicals onsite at the Spencer Metal Processing Plant caused the warning and evacuation at Nanticoke, Pennsylvania. The accident occurred about 15 minutes after midnight on March 24, 1987. Local officials were somewhat slow in assessing the gravity of the situation. After consulting the Chemical Transport Engineering Center, which is a part of the Chemical Manufacturers Association, officials decided to act on the worst-case scenario. The official evacuation began at about 2:20 AM. Records indicate the sirens for the Susquehanna Nuclear Power Plant were sounded at 2:21 AM and the Emergency Broadcast System broadcasts commenced at 2:30 AM. It is likely that the public was hearing other sirens from 12:30 AM onwards. The evacuation was a staged effort. The city was divided into quadrants. The quadrant nearest the plant was the first to evacuate. Officials decided to evacuate the northwest and west quadrants of the city at 2:50 AM. The evacuation of the remainder of Nanticoke began at 3:42 AM. Thus, we can identify three distinct geographically-determined groups of evacuees. Shortly after the incident, the Centers for Disease Control (CDC), in the Department of Health and Human Services, Atlanta, Georgia, conducted a telephone survey in Nanticoke. The general results of this survey along with the methodology are published elsewhere (Duclos, et al., 1989) [?].
Figure illustrates the warning, mobilization (PAI), and clearance time curves for the Nanticoke chemical evacuation.
Hurricane Floyd Mobilization (PAI) Curves
As reported from the National Hurricane Center, Floyd developed from a tropical wave off the coast of Africa on September 2, 1999. Floyd became a tropical storm on September 8, 1999 about 850 miles east of the Lesser Antilles and continued to move westward, becoming a hurricane about 240 miles northeast of the northern Leeward Islands. The westward movement changed to north-westward, temporarily halting its intensification trend. However, Floyd turned back to the west and strengthened into a major hurricane, intensifying to a Category 4 hurricane with 155 mile per hour winds. On September 13, Floyd ravaged portions of the central and northwest Bahamas heading for the U.S. Floyd continued to move along the Florida coastline, causing mass evacuations in Florida, Georgia, South Carolina, and North Carolina. Floyd eventually turned north westward and slowly weakened making landfall on September 16, 1999 near Cape Fear, North Carolina as a Category 2 hurricane. Hurricane Floyd moved over the eastern part of North Carolina and accelerated up the coast where it weakened to a tropical storm before moving into New England. Floyd lost its tropical storm characteristics by September 17, 1999.
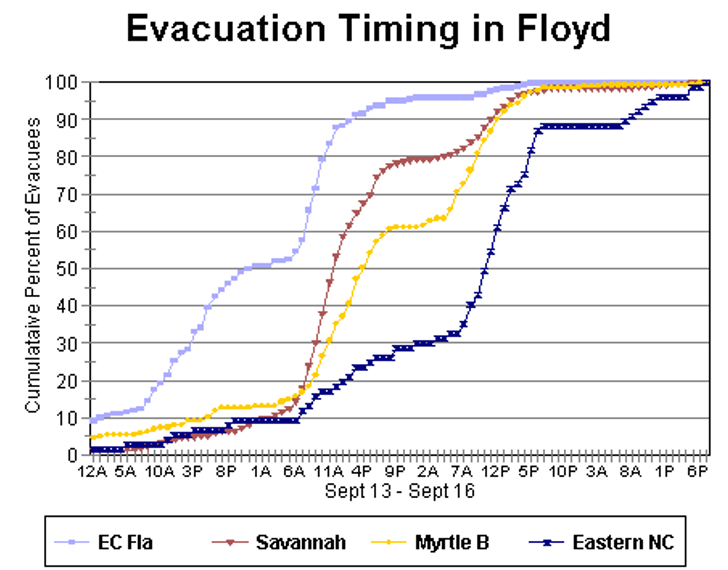
Figure is a sample of the "cumulative response curves" derived for each of the 11 areas. The vertical axis indicates the percentage of total evacuees from a location who had departed their homes by various times. The four curves show the progression of the evacuation commencing earlier to the south and gradually moving northward as the forecast track of the storm and warning areas moved northward. The curves are typical of "two-day" response curves – i.e., evacuations that take place over a period longer than 24 hours. The evacuation begins early on the first day, levels off at evening of the first day, then resumes the following day. Little evacuation began prior to evacuation notices being issued by officials.
Evacuation slows down considerably at night. These results were similar those in a survey conducted by Dow and Cutter (2002) [?] who found that the majority of residents, 61%, left on Tuesday between 6:00 AM and 9:00 PM followed by a second large group of 31% during the daylight hours of Wednesday. Hurricane Floyd made landfall in North Carolina early in the morning on Thursday, September 16.
Hurricane Fran Mobilization (PAI) Curves
Hurricane Fran moved across the Atlantic during the peak of the 1996 hurricane season. It made landfall on the North Carolina coast as a Category 3 hurricane on the Saffir/Simpson scale, resulting in significant storm surge flooding on the North Carolina coast, widespread wind damage over North Carolina and Virginia, and extensive flooding from the Carolinas to Pennsylvania. U. S. damages from the storm are estimated at $3.2 billion. Storm surge on the North Carolina coast destroyed or seriously damaged numerous beachfront houses. Widespread wind damage to trees and roofs, as well as downed power lines, occurred as Fran moved inland over North Carolina and Virginia. Extensive flooding was responsible for additional damage in the Carolinas, Virginia, West Virginia, Maryland, Ohio and Pennsylvania. Thirty-four deaths, with 21 in North Carolina alone, are attributed to Hurricane Fran's fury. Nearly a half-million tourists and residents were ordered to evacuate the coast in North and South Carolina.
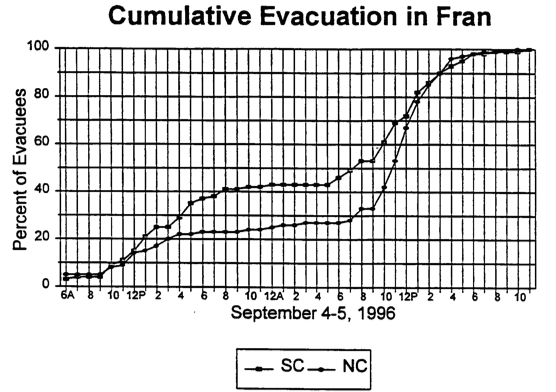
The results of a survey conducted for the U.S. Army Corps of Engineers following Fran asked what day and time they left their homes to go someplace safer are depicted in the graph in Figure, which shows cumulative evacuation over time – that is, of all evacuees, the percentage who had left by various times. There was little direct response to the hurricane watch, which was posted through South Carolina on the evening of September 3rd. The early evacuation began midmorning of the following day, probably due to the Governor's request to relocate. The change of the evacuation notice from voluntary relocation to mandatory evacuation appears to have reinforced the behavior already underway but did not clearly prompt additional response at that time. The evacuation paused on the evening of September 4th and, by nightfall, slightly more than 40% of the eventual evacuees had left. On the morning of September 5th, the evacuation resumed at a fast rate and slowed as the time of landfall approached.