Fatality Rates
Chapter Overview
A fatality rate function is used to determine how many people will succumb to high or low hazard flood conditions. A fatality rate is sampled for each group, then each individual in the group samples from the same chance of survival (more discussion in Life Loss). For example, an evacuation group of three people is caught in high hazard conditions. The group samples a 75% chance of fatality from the function. Then, each individual randomly samples a number (0-100%) which lands above or below the fatality rate. If the randomly sampled value falls above, then the person survives. This example results in 2 fatalities and 1 survival on average but could result in all surviving or all losing their lives. The functions used in LifeSim are the product of an extensive research and cataloging of historic flood events.
This chapter discusses how LifeSim uses high hazard and low hazard fatality rate functions to calculate direct fatalities. With any flood event, there exists the potential for indirect life loss, which is not currently included within LifeSim calculations. Indirect life loss occurs when the unsafe or unhealthy conditions present during any phase of the flood contribute to a death. This includes mortality from causes such as but not limited to stress-induced medical conditions (e.g., heart attack, suicide, etc.), water-borne sicknesses and infections, exposure, and lack of medical attention for treatable conditions. Previous studies of indirect life loss have estimated that up to 50% of fatalities that occur during a flood event are indirect in nature. USACE is currently developing a method to estimate indirect life loss that is compatible with LifeSim based on parameters such as number of evacuees and population health.
Development of Fatality Rate Functions
Unlike large-scale empirical approaches to estimating life loss, LifeSim focuses the estimate of potential loss of life at the individual or small group level. By explicitly simulating the evacuation process, LifeSim determines the location of all exposed agents, which are those people or groups of people that haven’t reached safety when the flood arrives. The exposed population can be in structures, vehicles, or on foot. The cause of the flood (dam failure, levee failure, hurricane, flash flood) is not relevant to the hydraulic characteristics at the agent location and the shelter provided by the structure or vehicle in which they are located.
After estimating the location, shelter, and hydraulic conditions for each agent in the simulation, the hazard zone for that agent must be identified. LifeSim characterizes each agent as either being in high hazard or low hazard conditions as described below:
- High hazard refers to those conditions where the stability criteria or submergence criteria of the person, the vehicle (if caught while evacuating in a car or SUV), or the structure (if not mobilized) has been exceeded. In that situation, the victims are typically swept downstream, buried in a collapsed building, or trapped underwater, and survival depends largely on chance.
- Low hazard refers to those conditions where the person or group of people is exposed to relatively calm floodwaters, where their stability or the stability of their shelter is not at risk. A hazard exists due to the potential for bad things to happen when people come in contact with water in locations not meant for such an interaction.
Once a hazard condition has been identified, the final step is applying a fatality rate that represents the likelihood of someone in those conditions dying. This is an important, necessary step in the LifeSim simulation that accounts for the basic concept that people can – and often do – survive conditions that would generally be considered un-survivable. Likewise, people can – but rarely do – die in conditions where they would be expected to survive.
Development of Flood Fatality Database
A historic flood fatality database was developed for LIFESim, the life loss estimation program precursor to LifeSim (McClelland and Bowles, 2002) [?]. The database is categorized by hazard zone based on shelter and hydraulic conditions. This database stores fatality rates at a population group resolution, meaning a single event can have multiple fatality rates. The three hazard zones were defined as chance, compromised, and safe. New cases have occurred since the development of the fatality rate database. The LifeSim 2.0 development team set out to update and refine the database. When examining historic data, the team found it difficult to clearly identify the compromised zone. One reason is that detailed accounts are easy to classify into chance or safe zones, which is reflected in the data. The team reconfigured available information and developed two new zones: low and high hazard. With the new zone definitions, smaller distinct groups were identified to better support an agent-based approach. New case studies informed low and high hazard functions. The team also identified many data points that were not included in the original database but could be used to expand it. This was an important step to maintain a significant sample size because any point that could not be verified was removed from the final function.
Fatality rates are categorized by population group to ensure that the hazard conditions are consistent for that group, i.e., all passengers in a car, or all occupants of the same building, or traveling together. This level of granularity was harder to find for older events, leaving many of them to be excluded from the new functions. A more rigid definition of group size and hazard classification makes the functions more appropriate for agent-based modeling as used in LifeSim.
Each population group is given a hazard classification (low or high) based on whether their stability or the stability of their structure or vehicle was lost or they were submerged. Indirect fatalities were removed from the analysis. To calculate a fatality rate, each group in the database must include enough information to determine the number of people who died and survived, as well as the severity of the flood conditions they were exposed to. Most of these stories were recorded in newspapers, books, social media, and academic articles. Occasionally, the flood conditions were assumed based on the results of modeling or other flood data points and information about the group's location.
Presentation of Functions
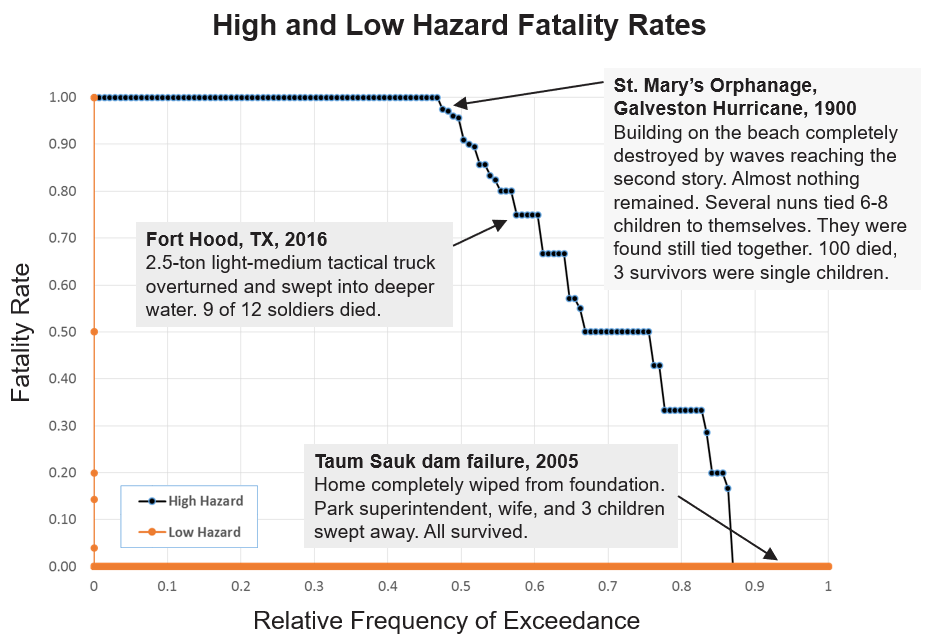
The high hazard function contains 139 points, shown in Figure. The high hazard function still exhibits some availability bias in the plateaus around 1/3, 1/2, and 2/3. These represent the abundance of groups with 2 and 3 people in the dataset. It is not clear from research, but that may also reflect the circumstances most people would find themselves in (small groups). Therefore, the function remains as-is until more information is available. Typical points include people who were in buildings that flooded or collapsed, or vehicles that washed off the road (fatality rate database in draft, 2019).
Anecdotal evidence suggests many people who find themselves in low hazard circumstances are never reported because they survive. Capturing the zero fatality rate cases is especially important for low hazard classification because there are so many people that survive.
To overcome the lack of zeroes in the documented low hazard data, historic events were modeled in LifeSim to estimate the population that was exposed to low hazard conditions. Case studies included the 2015 Kinugawa River levee breach, Hurricane Harvey, and Hurricane Katrina (data on New Orleans East Bowl only). The LifeSim results provided estimates of the total number of evacuating groups that were exposed to low hazard conditions. Table provides the simulated low hazard group estimates from LifeSim. Summing the average estimate for groups in low hazard conditions results in 311,152 total population groups exposed to low hazard conditions. These results do not account for rescue operations which would reduce the estimate further. No sources could be determined for accurate estimates of people rescued from low hazard conditions.
| Case History | Min | 25th | Mean | Median | 75th | Max |
|---|---|---|---|---|---|---|
| Kinugawa Levee | 3,190 | 3,266 | 3,304 | 3,308 | 3,334 | 3,485 |
| New Orleans East Bowl | 2,631 | 3,121 | 3,642 | 3,666 | 4,119 | 4,734 |
| Hurricane Harvey (Houston Area) | 303,866 | 304,108 | 304,206 | 304,223 | 304,302 | 304,524 |
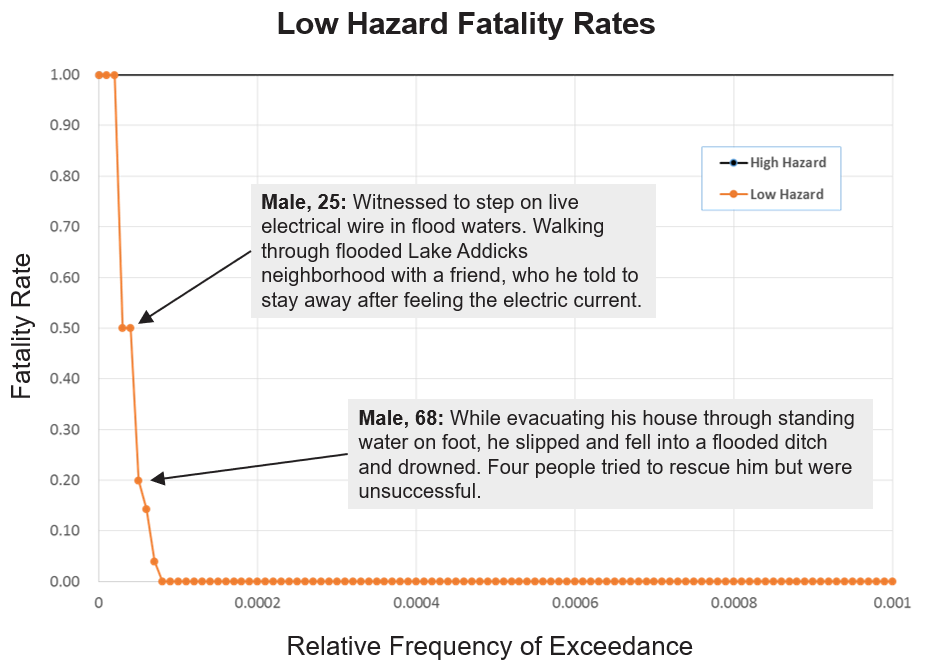
Hurricane Harvey had more people estimated to be exposed to low hazard conditions primarily due to the large population at risk, a shelter-in-place order, and widespread shallow flooding. Documented cases of low hazard fatalities were included for each case history to ensure a representative dataset. The resulting function is mostly zero data points making the low hazard zone only a significant contributor to overall life loss when very large populations are found in low hazard circumstances. Figure shows the low hazard fatality rate function zoomed into the region with higher fatality rates.
Typical low hazard fatalities include people who evacuated (or "fled") through shallow water in their cars or on foot, people who were in partially-flooded structures and experienced an unfortunate circumstance (e.g., slipped, electrocuted through water), and people who willingly entered the flooded area to retrieve belongings or rescue others.