Appendix C - Excerpt from First Alert or Warning Diffusion Time Estimation for Dam Breaches, Controlled Dam Releases and Levee Breaches or Overtopping
The following is excerpted from an undated document produced for the USACE Risk Management Center by John H. Sorensen and Dennis S. Mileti titled First Alert or Warning Diffusion Time Estimation for Dam Breaches, Controlled Dam Releases and Levee Breaches or Overtopping. The full draft document is available here.
Previous Research on Diffusion Curves
In this section of this working paper we present a brief overview of previous research on warning diffusion including point estimates of first alert diffusion curves for discrete events, daytime versus nighttime estimates, and 3 models including the Rogers and Sorensen model, the Lindell model, and the Klaftt model. We used the author's terminology and definitions in presenting the findings of their research and did not seek to compare variations in usage of terms. By default, we accepted the researcher's definition of the population studied and sampling frame. This makes comparisons and normalization of data difficult. For example, some researchers studied the population defined to be at risk, others studied people in areas that evacuated, some investigated the population targeted with warnings, others the population who received the warnings, and still others people in a geopolitical area in which an event occurred.
Historical Event Estimates for Diffusion Rates
We were able to locate over two-dozen historical events in which data about first alert diffusion were presented by researchers. First alert diffusion data was largely not the prime motive for conducting the research in the published record. Hence, the type of available data that exists across historical event varies widely. These data, the events from which they were collected, and reference to the publication that contains the data are presented in Table. How these distributions might have changed given today's technologies and social climate is an important research question.
A review of the first alert dissemination channels across events presented in Table illustrates that history provides wide variation in the first alert diffusion effectiveness of any one type of alert channel. The same wide variation can be observed, to the extent that data is available, on the length of time that was needed to provide a first alert to virtually the whole population across the included events.
| Event | Informal | Sirens | Local Officials | Cues | TV/Radio | Weather radio | Route | Telephone | Time of Day | Total Warning time | Reference | |
|---|---|---|---|---|---|---|---|---|---|---|---|---|
| Denver Flood | 28 | Drabek and Stephenson, 1971 [?] | ||||||||||
| Abilene Flood | 24 | 32 | 44 | Day | 6+ hours | Perry and Mushkatel, 1986 [?] | ||||||
| Sumner Flood | 78 | 11 | 0 | Night to Day | ? | Perry et al., 1981 [?] | ||||||
| Valley Flood | 35 | 39 | 19 | Day | 0.5 - 3 hours | |||||||
| Fillmore Flood | 37 | 59 | 0 | 6+ hours | ||||||||
| Snoqualmie Flood | 41 | 47 | 14 | |||||||||
| Mt. St. Helens Volcano Toutle | 58 | 6 | 30 | 6 | Day 8:30 AM | 2 hours | Perry and Greene, 1983 [?] | |||||
| Mt. St. Helens Volcano Woodland | 47 | 0 | 14 | 39 | ||||||||
| Mt. St. Helens Ash | 52 | 44 | Day | 9 hours | Dillman et al., 1983 [?] | |||||||
| Clarksburg Flood | 5 | 89 | N/A | Leik et al., 1981 [?] | ||||||||
| Rochester Flood | 33 | 69 | N/A | |||||||||
| Palo Duro Flood | 7 | 85 | N/A | |||||||||
| Boise Flood | 0 | 87 | N/A | |||||||||
| New Orleans Flood | 85 | N/A | ||||||||||
| Atlanta Flood | 3 | 89 | N/A | |||||||||
| Sedona Flood | 20 | N/A | ||||||||||
| Wheeling Flood | 1 | 74 | ||||||||||
| Hurricane David | 5 | 92 | Night & Day | Several days | ||||||||
| Hurricane Frederick | 16 | 89 | ||||||||||
| Mississauga Chemical Accident | 24 | Day | Series of warnings | Burton, 1981 [?] | ||||||||
| Mt. Vernon Chemical Accident | 44 | 37 | 19 | Day 10:00 AM | 2.5 hours | Perry and Mushkatel, 1986 [?] | ||||||
| Denver Chemical Accident | 58 | 24 | 18 | Day 5:30 PM | ? | |||||||
| Confluence, PA Chemical Spill | 89 | Night 4:20 AM | 4 hours | Rogers and Sorensen, 1989 [?] | ||||||||
| Pittsburg, PA Chemical Spill | 18 | 17 | 58 | Day 1:00 PM | ||||||||
| Nanticoke Chemical Accident | 38 | 34 | 5 | 21 | Night 1:00 AM | 3 hours | Duclos et al., 1989 [?]; Sorensen, 1992 [?] | |||||
| Helena, AR Chemical Accident | 46 | 37 | Day | Vogt and Sorensen 1999 [?] | ||||||||
| Graniteville, SC Chemical Accident | 24 | 6 | 49 | 0 | 21 | Night 5:00 AM | 12 hours | Mitchell et al., 2005 [?] | ||||
| Collins, MS Chemical Accident | 31 | 58 | 0 | Day 1:00 PM | 6+ hours | Duclos et al., 1987 [?] | ||||||
| San Diego Wildfires | 8 | 4 | 8 | 1 | 1 | 42 | Day and Night | Several days – series of warnings | Sorensen et al., 2009 [?] | |||
| Tornado 3 States | 10 | 76 | 23 | Paul et al., 2003 [?] | ||||||||
| Flood Denver | 5 | 7 | 46 | 33 | 1 | N/A | Gruntfest and Benight, 2005 [?] | |||||
| World Trade Center 9/11 | 13 | 81 | Day | 1 hour | Averill et al., 2005 [?] |
Nanticoke Diffusion Curve
A fire that threatened to burn toxic chemicals onsite at the Spencer Metal Processing Plant caused the warning and evacuation at Nanticoke, Pennsylvania. The accident occurred about 15 minutes after midnight on March 24, 1987. Local officials were somewhat slow in assessing the gravity of the situation. After consulting the Chemical Transport Engineering Center, which is a part of the Chemical Manufacturers Association, officials decided to act on the worst-case scenario. The official evacuation began at about 2:20 AM. Records indicate the sirens for the Susquehanna Nuclear Power Plant were sounded at 2:21 AM and the Emergency Broadcast System broadcasts commenced at 2:30 AM. It is likely that the public was hearing other sirens from 12:30 AM onwards. The evacuation was a staged effort. The city was divided into quadrants. The quadrant nearest the plant was the first to evacuate. Officials decided to evacuate the northwest and west quadrants of the city at 2:50 AM. The evacuation of the remainder of Nanticoke began at 3:42 AM. Thus, we can identify three distinct geographically-determined groups of evacuees. Shortly after the incident, the Centers for Disease Control (CDC), in the Department of Health and Human Services, Atlanta, Georgia, conducted a telephone survey in Nanticoke. The general results of this survey along with the methodology are published elsewhere (Duclos, et al., 1989) [?].
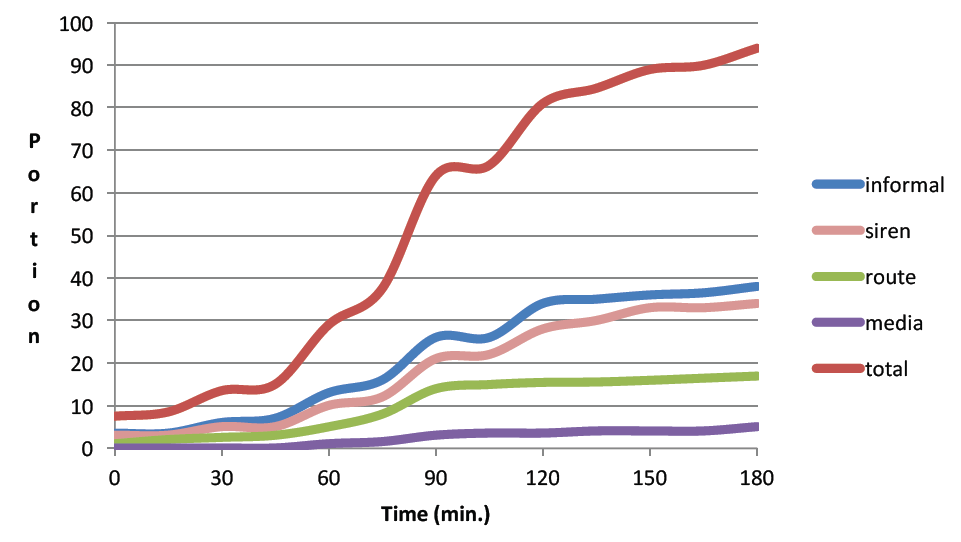
The CDC survey described ways in which people were warned to evacuate. These methods included sirens, officials going through the streets with loudspeakers, officials going door-to-door, friends or relatives going to someone's door, telephone calls from friends or relatives, radio, and television. In fact, these are all common means that are used to warn people in emergencies (Lindell and Perry, 1987 [?]; Sorensen and Mileti, 1990 [?]). Perhaps the most significant aspect of the warning is that the town of Nanticoke is within the 10-mile emergency planning zone (EPZ) for the Susquehanna Nuclear Power Plant. As a result, the town is blanketed with coverage by the sirens that would be used to alert the public to a potential emergency at that plant. This alert system consists of 110 sirens and includes 44 Federal Signal Thunderbolt 1000s, 50 FS STHl0s, and 16 FS 5s. The sirens are rated at 125, 115, and 105 dB, respectively. On July 30, 1986, a test of the sirens was made at 11:55 AM, and a telephone survey was conducted to determine how many people heard the sirens. Results indicated that 76.5% of those persons polled heard the sirens. Figure presents the CDC survey data regarding how people first learned of the need to evacuate by source over time. It is the best data we have regarding the diffusion generated by specific warning sources or channels.
Pittsburgh and Confluence Diffusion Curves
On Saturday, April 11, 1987 at 12:29 PM, a westbound Conrail freight train derailed in Pittsburgh, Pennsylvania. In the process of derailing, the westbound train sideswiped an eastbound train causing it to derail. Four tank cars containing hazardous materials on the eastbound train were derailed. Sparks resulting from the accident ignited a fire. Because of the involvement of hazardous materials, Pittsburgh emergency personnel initiated an evacuation upon arrival at the scene about 20 minutes after the accident. Apparently recognizing signs of potential danger, some local residents in the immediate adjacent areas had already begun to evacuate. Up to 22,000 people were evacuated as the initial evacuation area was expanded to accommodate changing weather conditions.
By 5:50 PM, the affected areas had been declared safe and the initial evacuation order was rescinded. Emergency officials planned a second precautionary evacuation for 1:00 PM the following day to upright the leaking tank car; however, a close inspection of the damaged tank car shortly after midnight detected continued deterioration of the tank car. At 1:30 AM, an evacuation order affecting between 14,000 and 16,000 residents within a half mile of the scene was issued. This second evacuation order was not rescinded until 4:30 PM on Sunday, April 12, 1987. Approximately 25 people were treated for eye and throat irritation at area hospitals, and three people were hospitalized during the course of the accident.
On Wednesday, May 6, 1987 at 4:10 AM, 21 of the 27 "empty" tank cars carrying product residues, including propane, chlorine, caustic soda, carbon disulfide, methyl chloride, chloroform, and isobutene derailed in Confluence, Pennsylvania. Because tank cars carrying residue can haul up to 3% of their full load, emergency officials had no way to determine the exact total amount of products remaining in the cars. Upon examination of the train's manifest, emergency management officials initiated a precautionary evacuation of the 986 residents. A 3-minute non-stop siren blast was sounded, which primarily alerted the volunteer firemen as residents could not be aware of the specific meaning of this siren-blast; although it could serve as an alert to those who heard it.
At approximately 4:30 AM, a door-to-door and portable loudspeaker alert and notification of the emergency began using volunteer firemen and un-trained volunteers. Public shelters were set up in the area's high school, and local school buses and ambulances provided transportation for those needing it. The researchers reported that officials indicated the evacuation was completed in 45 minutes. Assistance from area-wide emergency personnel sealed two leaking propane tankers by 9:48 AM, but the chance of explosion and/or fire during wreckage cleanup prevented return until 6:10 PM.
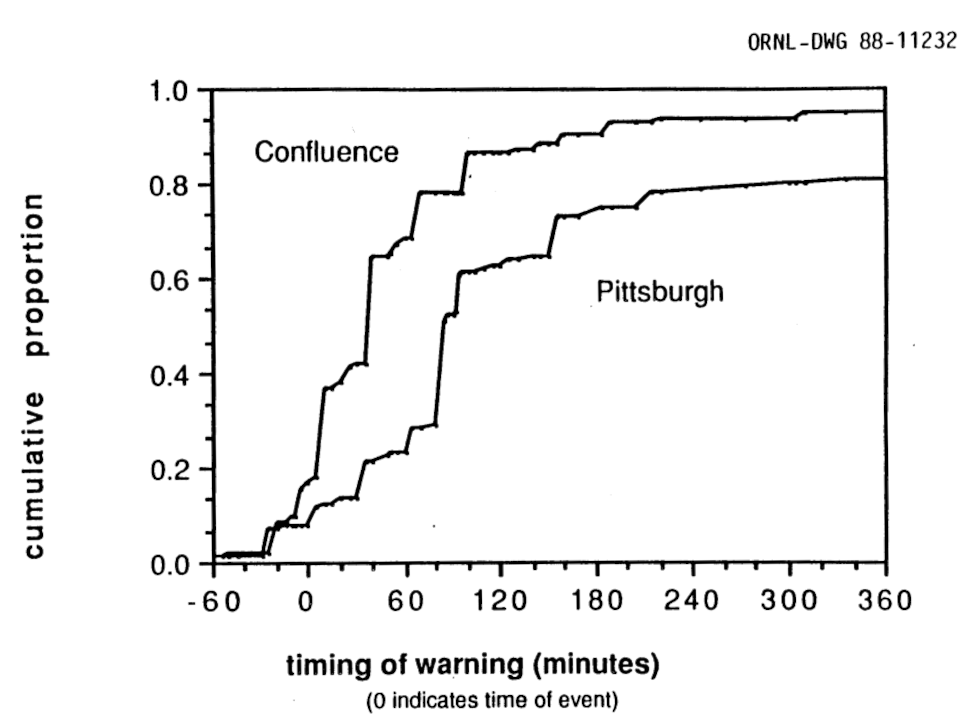
Rogers and Sorensen (1989) [?] describe the study methods and data collection. Using this data, the following curves were plotted for the two events (see Figure).
West Helena Diffusion Curve
The herbicide and pesticide chemical repackaging facility where the accident occurred is located in an industrial park in West Helena, Arkansas. The industrial park adjoins a railroad track spur and is the site of a number of other chemical and manufacturing industries. The incident began at approximately 10:00 AM on Thursday, May 8, 1997, when some agricultural chemicals were delivered to the plant. Workers recall that one of the 1,500-lb bulk containers of azinphos-methyl had a strange, almost rancid, odor when delivered to the plant. The container, double wrapped in disposable heavy duty plastic, was brought into the plant where, several hours later, it started to emit fumes. As the fumes spread from the container, creating a smoky haze, plant employees evacuated to the parking lot of the building across the street; and managers conducted a head count to make sure all employees were out of the building.
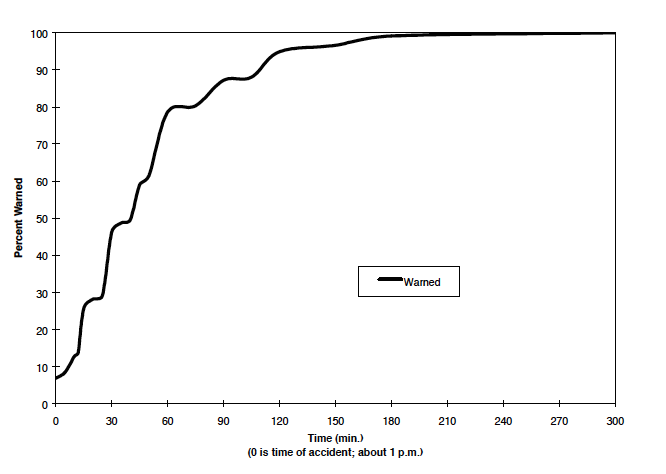
The public was warned by major sources including: media – TV or radio, National Guard or state government officials, and informal sources including neighbors, friends, co-workers, family members or relatives. The receipt time for these first alerts is shown in Figure.
Mt. St. Helens Ash Fall Diffusion Curve
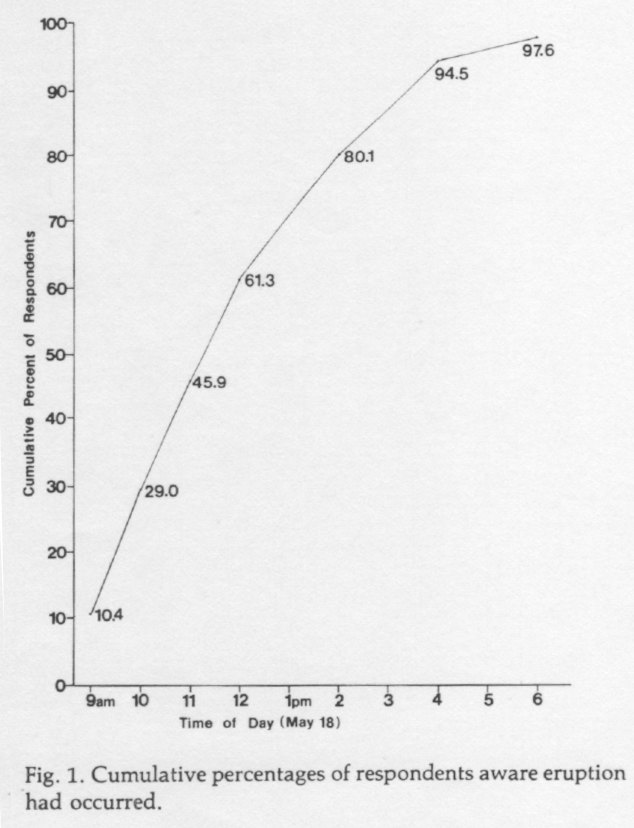
Dillman et al. (1983) [?] studied the receipt of information about the volcanic eruption at Mt. St. Helens in Spokane Washington, which would experience major ash fall from the eruption. Most people learned of the ash fall hazard through informal or media sources as no official warning was issued. The diffusion of information, which led to the first awareness of the eruption, is shown in Figure.
Mt. St. Helens Eruption Diffusion Curves
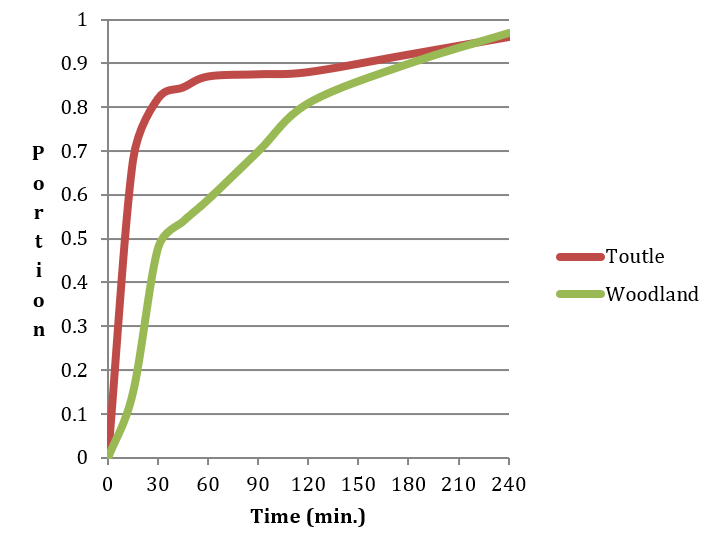
Perry and Greene (1983) [?] provide detailed warning diffusion information and data for the communities of Toutle/Silverlake and Woodland in Washington State for the May 18, 1980 eruption of Mt. St. Helens.
Most residents in Toutle/Silverlake first became aware of the eruption by physical cues, which included seeing the large mushroom-shaped ash cloud to the south, a dramatic increase in temperature, the sounds of trees and automobile windshields cracking from the heat, and Silverlake experienced slight ash fall about 1.5 hours after the initial eruption. The most significant threat to residents in these communities was from mudflows and flooding in the Toutle River. County deputies alerted most residents by driving pre-designated routes using sirens and public address systems. A telephone ring down system was used to alert residents in pre-designated high flood hazard areas. The fire department blocked road access to keep sightseers and other people out of the at-risk area.
What occurred in Woodland, which is situated along the Columbia River, on the south side of the volcano, was different. Prior to the eruption on May 18th, officials were primarily concerned about the risk of flooding to their community in the event of a volcanic eruption. The concern was based on the fact that reservoirs could quickly be filled to overflowing in an eruption from volcano-induced mudflows. A great deal of pre-event publicity was provided to the residents of Woodland about how serious the threat of flooding would be for their community during an eruption, and they could clearly see the ash cloud when the eruption occurred. In fact, the flooding that occurred the day of the eruption was very minor.
Toutle is located close to the volcano on the side toward which the blast from the May 18, 1980 eruption was directed (Lindell and Perry, 2004) [?]. Figure presents the first alert diffusion curves in the communities of Toutle and Woodland.
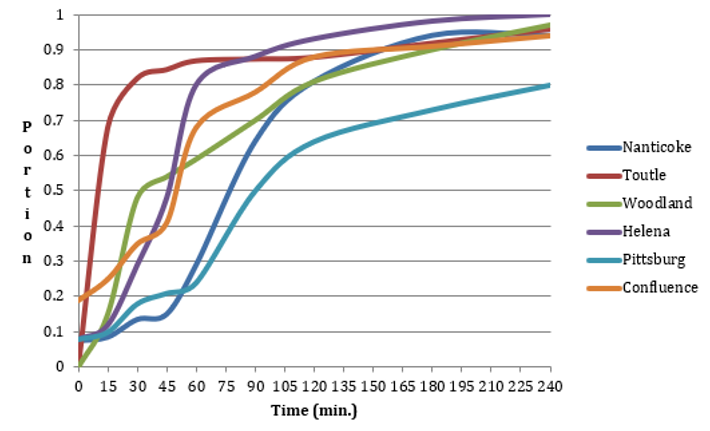
The warning time curve for Toutle rises very steeply because warnings were disseminated by multiple sources (Lindell et. al., 2002) [?]. The curve for Woodland is less steep (see Section 5.10 [of full draft First Alert or Warning Diffusion Time Estimation for Dam Breaches, Controlled Dam Releases and Levee Breaches or Overtopping] for a further discussion of these curves).
Boulder WEA Diffusion
Between September 11-15, 2013 Colorado's Front Range experienced catastrophic flash flooding that began when record rainfall from a slow moving cold front stalled over Colorado, colliding with warm humid air from the equator. Boulder received 17.16 inches of rainfall between September 10-15, 2013 (the annual average is 20.7 inches). On September 12, Boulder Creek crested at approximately 5,000 cubic feet per second (cfs). Normally it flows between 100-300 cfs. The rainfall that the City of Boulder experienced translates to a 1 in 1,000 per year rain event, and a 1 in 100 per year flood event. Serious damage was sustained to buildings along the creek and the creek path.
The National Weather Service issued the first notification of a flash flood for Boulder. It was a Wireless Emergency Alert (WEA message) that was distributed over mobile communication devices to both the city and county and to the public at 6:36 PM on September 11, 2013. The message stated: "Flash Flood Warning this area until 9:30 PM MDT. Avoid flood areas. Check local media. -NWS." A study of the diffusion of the first WEA message was conducted (Bean, et al. 2014) [?], and Figure presents the Boulder first alert diffusion curve normalized for 100% of the population.
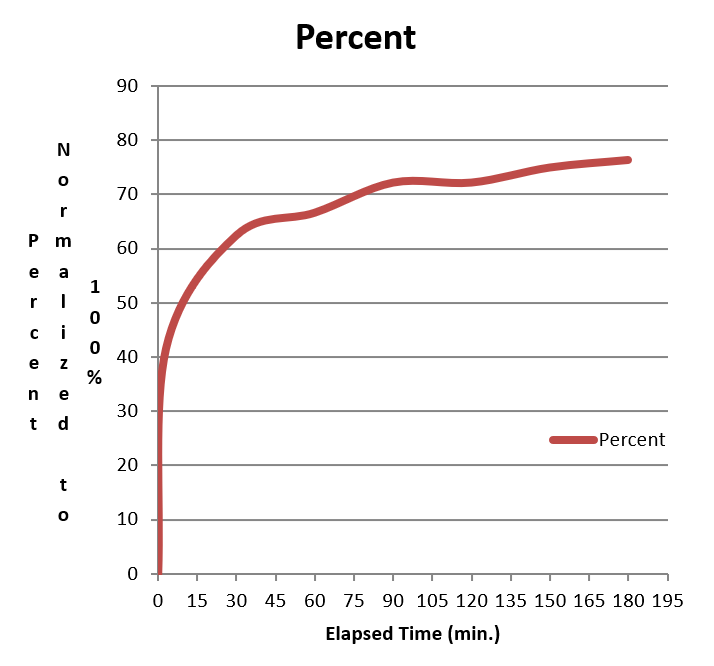
Figure shows first alert diffusion curves developed from data for the six case histories described above. Although the general shape of the diffusion is similar for all events, the speed and acceleration/deceleration of each curve are specific to the event. These curves are not smooth because they depict reported data from interviewees who tend to anchor their estimates to rounded numbers such as 15 or 30 minutes rather than precise numbers such as 13 and 29 minutes.