

Warning and Protective Action Parameters
Chapter Overview
The warning and protective action framework used in LifeSim builds on decades of research in Protective Action Decision Making (PADM), specifically drawing on its application to environmental disaster response as advocated by M. Lindell, C. Prater, R. Perry, D. Mileti, J. Sorensen, and others. The warning and protective action parameters taken together describe the flow of information and decision making from discovery of a problem to people taking protective action against the hazard.
Two types of protective action are modeled in LifeSim: horizontal evacuation (by car or on foot) and vertical evacuation (seeking the highest point in a structure). Other types of protective action such as rescue are not yet modeled. The data required to validate a rescue model is not readily available. The warning and evacuation (protective action) system redistributes the population from their initial locations at the time that a warning is issued to new locations with assigned hazard zone categories, i.e., no hazard, low hazard, or high hazard. LifeSim does this through simulation of the warning issuance time, first alert diffusion, protective action initiation, and evacuation-transportation processes. Redistribution includes horizontal evacuation in a vehicle or on foot along road networks and vertical evacuation within structures.
LifeSim includes a suite of pre-set warning and evacuation parameters that were developed using the findings of Mileti and Sorensen, 2015 [?]. Users are able to adjust these parameters to better reflect the specific situation in the study area.
In this chapter, each parameter is defined, research and development is presented, and its role and effect on the LifeSim simulation are explained. Definitions are provided for warning and protective action parameters. The defined parameters are related to warning issuance, first alert diffusion, and protective action initiation for evacuation areas that must be defined when configuring a LifeSim life loss simulation.
Within the Research and Development sub-sections, warning and protective action parameters are explained using an example case study. The case study used is the Oroville Dam emergency spillway incident, which took place near Oroville, California in February 2017. Geologists and other dam safety managers became concerned when erosion downstream of the spillway was head cutting back toward the emergency spillway control weir more rapidly than expected. If erosion continued toward the emergency spillway, they feared a monolith could fail leading to the failure of adjacent monoliths causing a complete spillway failure. The USACE RMC LifeSim validation study of the Oroville incident is available at LifeSim Validation Studies - Oroville.
Warning and Evacuation Timeline
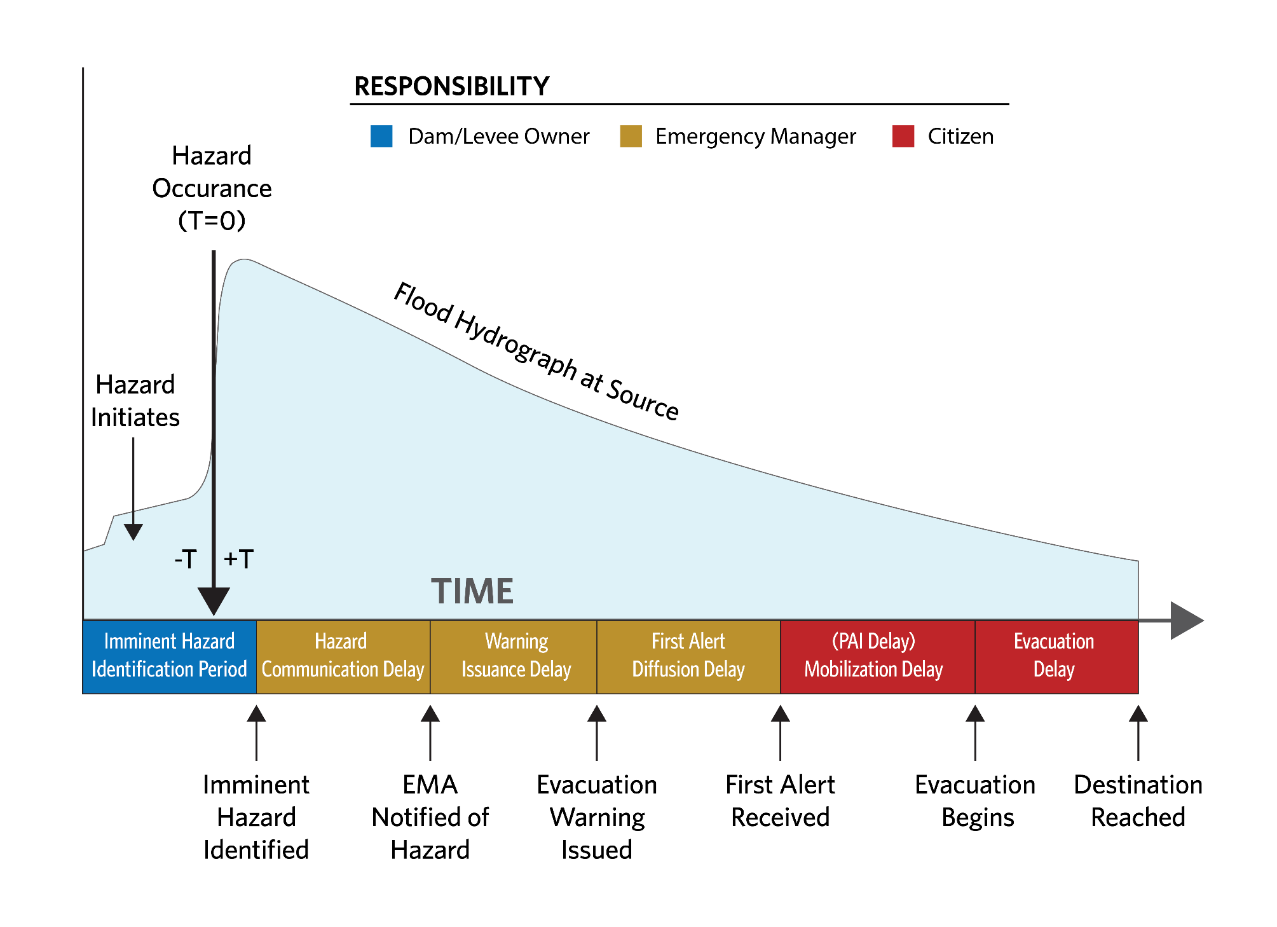
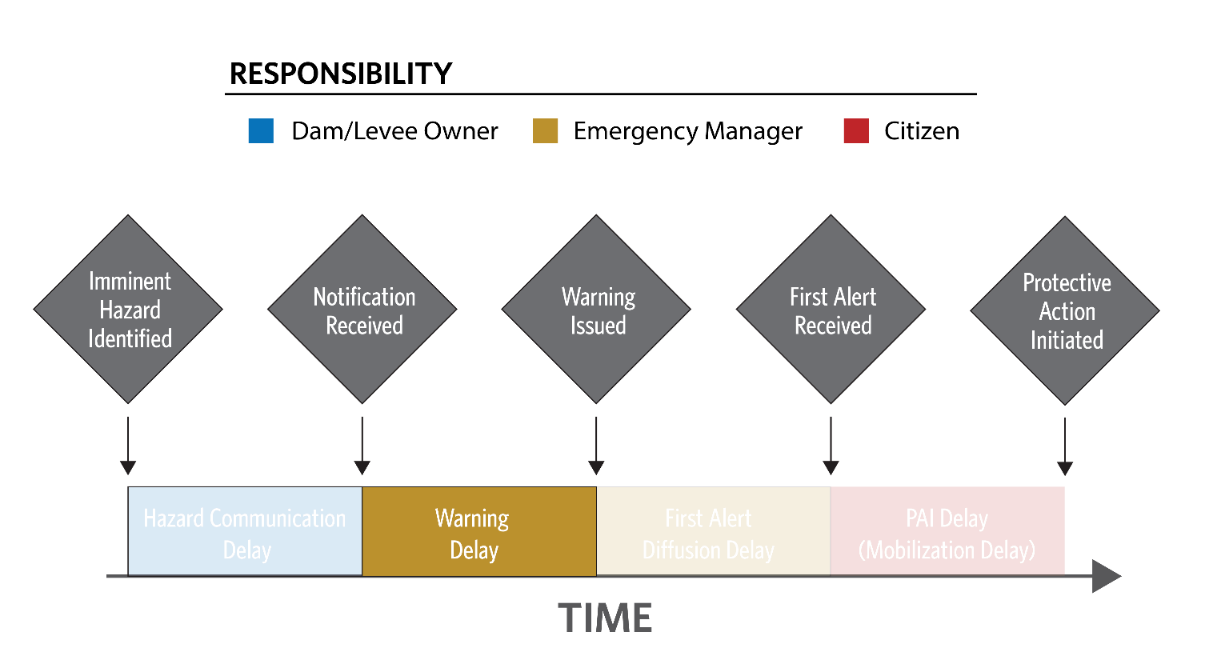
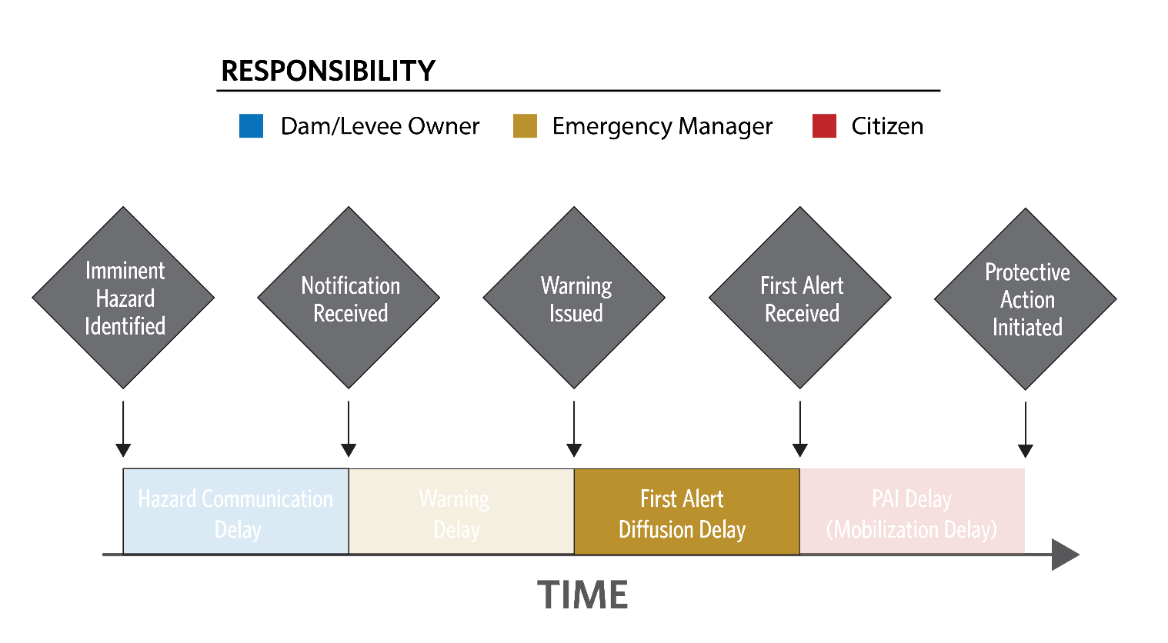
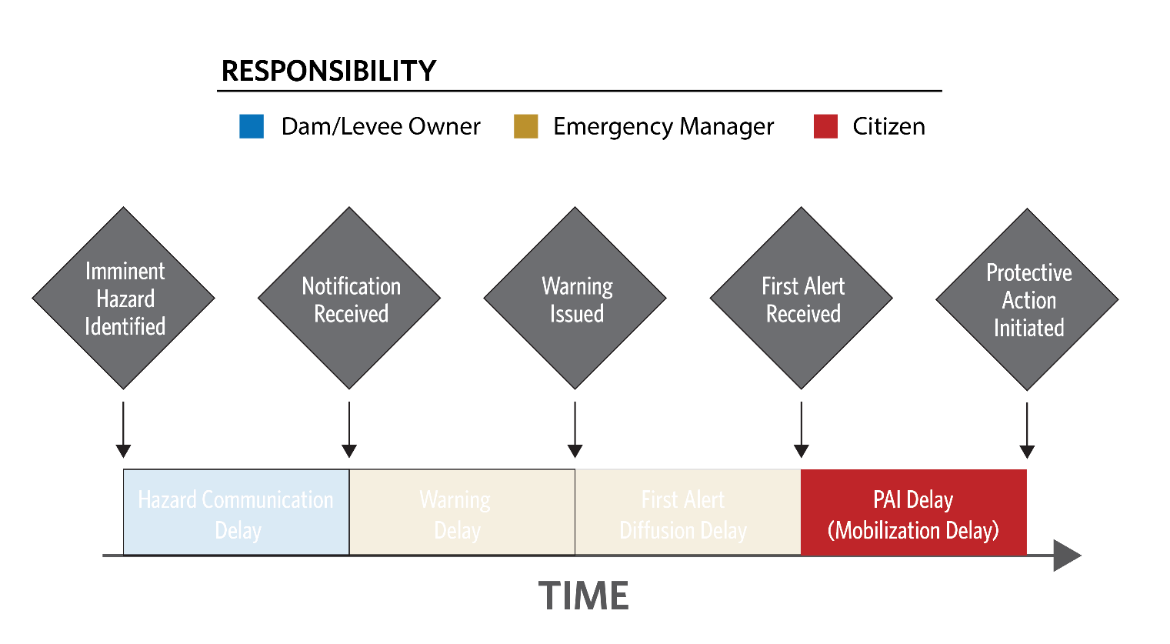
The LifeSim warning and evacuation timeline (illustrated in Figure) identifies points in time and the time periods between the points in time (delays) required to warn and evacuate the PAR.
The points in time include:
- Hazard occurrence time
- Imminent hazard identified
- Emergency Management Agency (EMA) notified of hazard
- Evacuation warning issued
- First alert received by public
- Evacuation begins
- Destinations reached
The periods between the points in time are referred to as delays. They include:
- Imminent hazard identification period
- Hazard communication delay
- Warning issuance delay
- First alert diffusion delay
- Protective action initiation (PAI) delay
- Evacuation delay
This timeline starts just prior to the hazard initiating. The period of time between when the hazard is identified and the hazard occurs is defined as the imminent hazard identification period. It is important to note that the imminent hazard identification can happen before or after the hazard occurs. Next, the hazard communication delay is the period of time it takes for whoever identified the hazard to alert the EMA. Once the EMA is notified of the hazard, information regarding the hazard (i.e., a warning) must be communicated to the public. The time period it takes for EMAs to compile the message and issue a warning is the warning issuance delay. At this point in time, the warning is issued to the PAR. It takes time for the warning, or first alert, to be disseminated to the public. This period of time is referred to as the first alert diffusion delay. Once the population receives the first alert, they will decide to take protective action or not. This decision process is the PAI delay. If they decide to take action and evacuate, the time period it takes for them to reach their destination is the evacuation delay. For the evacuation to be successful, the protective action has to begin in time for the population at risk (PAR) to reach safety before the hazard arrives.
Figure graphically displays the warning and evacuation timeline used in LifeSim. The timeline comprises time periods, or delays, between points in the timeline. All time periods on the timeline are cumulative from left to right. Each delay can be represented with uncertainty in LifeSim. The first alert diffusion and PAI delays are modeled with natural variability. Refer to Uncertainty and Sampling Methods for discussion on LifeSim sampling.
Three "entities" are involved in the warning and evacuation timeline:
- The dam or levee owner or operator
- The emergency management agency
- The PAR
LifeSim makes certain assumptions about who is responsible for various actions, and how these actions interact to determine the duration of time periods in the warning and evacuation timeline. The LifeSim user must gain an understanding of whether these assumptions reflect their study. The entities, their roles, and their impacts on the warning-evacuation timeline are shown in Table.
| Entity | Role | Impact on Timeline |
|---|---|---|
| Dam or levee owner/operator |
| The actions of the dam or levee owner/ operator impact the Warning Delay Time. In some cases, a bystander or other observer detects the failure mode. In that case, the incipient or actual failure may be reported directly to an emergency management agency. |
| Emergency management agencies (EMA) |
| The actions of the EMAs affect the Warning Delay Time, the First Alert Diffusion Time, and the Protective Action Initiation. |
| Population* |
| The characteristics and actions of the population (or sub-populations) affect the First Alert Diffusion and the Protective Action Initiation Time. |
- *Note: There may be one or several sub-populations.
Emergency Planning Zone (EPZ)
Definition of an EPZ
An EPZ is a geospatial area where the warning and evacuation characteristics are homogeneous; the EMA responsible for evacuating people within the EPZ will have the same evacuation planning and preparedness, community participation and awareness, and types of flood warning systems available. The EPZ should also be subjected to relatively similar conditions, such that messaging would be the same to everyone in the zone. For example, a community divided by a flooding river may be all in one jurisdiction and subjected to similar flooding and arrival time on both sides of the river, but the warning message might instruct them to evacuate at different times or in different directions. In this case, two separate EPZs should be defined.
EPZs can be defined by well-known political boundaries, geographical features such as rivers, and/or major roads. EPZ boundaries usually coincide with boundaries of a city, county, or other defined area in which a single emergency manager or sheriff has jurisdiction. The identification of geographical features is especially important because these can serve as evacuation impediments. Mountains, peninsulas, islands, and rivers can all restrict the number, directions, and capacities of evacuation routes (Lindell, 2013) [?].
EPZs are defined in LifeSim with a shapefile. The user may define as many EPZs as desired – including EPZs inside the boundary of another, such as for hospitals, prisons, or other facilities that have their own unique warning and evacuation procedures. Other characteristics that may call for a separate EPZ include distance from the hazard, demographics, and other factors that isolate a geographically-specific group.
People evacuating from within an EPZ will automatically choose the destination they can reach in the shortest travel time. If evacuation is being simulated, simulating traffic can be turned off for all structures in an EPZ. Turning off evacuation for an EPZ assumes that anyone in that EPZ who takes protective action to evacuate away from their structure will reach safety.
The following parameters are defined at the EPZ scale and are used for warning and evacuation for the population within each EPZ:
- Imminent hazard identification period
- Hazard communication delay
- Warning issuance delay
- First alert diffusion delay
- Protective action initiation delay
- Simulate traffic
- Available destinations
For example, four EPZs were initially considered for the 2017 Oroville Spillway incident: Butte County, Sutter County, Yuba County, and Yuba City. Butte County is closest in proximity to the dam, Sutter and Yuba Counties are downstream of the dam, and Yuba City is the largest city within Sutter County and had a specific evacuation order separate from the county. The final validation model has 10 EPZs, each with its own set of warning and evacuation parameters based on location, city, and county information – available for download below.
🡇 Download Oroville ModelHazard Occurrence Time
Definition of Hazard Occurrence Time
The hazard occurrence time is defined as the point in time when the hazard (e.g., dam failure, levee overtopping) occurs. It is the anchor point for all other time-dependent warning and evacuation parameters within the simulation. The time must be manually defined by the user. More information on defining the hazard occurrence time in LifeSim may be found in Defining Hazard Occurrence and First Time Step. The hazard occurrence time is not dependent upon human perception of the hazard; it happens regardless of whether anyone is aware of it. Thus, the hazard occurrence time may or may not be witnessed by personnel at the hazard source (e.g., dam or levee).
The hazard occurrence time can occur before or after recognition (identification) of the hazard. The hazard and its occurrence time are defined once for each hydraulic scenario (floodplain).
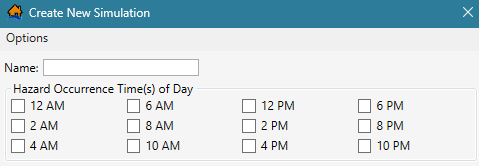
In the Simulations study component, the hazard occurrence time is set to one of twelve default times of day (every two hours; see Figure). The date and time of the hydrograph used to define the hazard occurrence becomes irrelevant as the anchor point is redefined. Multiple times of day can be selected for the same simulation, with 2 AM and 2 PM being the most common selections, representing day and night conditions. If any parts of the alternative are dependent on modeling differences by time of day, the time of day selection should be coordinated with those assumptions. For example, a dam only staffed during the day may have a very different imminent hazard identification time during working and non-working hours.
Research and Development
Because the hazard occurrence point in time describes a physical state, research is not required. However, users may want to familiarize themselves with differences in terminology that exist for the various phases of a breach. For consistency with the HEC-RAS definition, the hazard occurrence time is the beginning of the "breach formation time." This time is physically characterized in HEC-RAS as the point when the structure breach begins opening. Other references may include excessive leakage from the structure as part of the formation time.
For the 2017 Oroville Spillway incident, there was no hazard occurrence time identified as a breach of the emergency spillway did not occur. Since the breach of the emergency spillway weir was avoided by drawing down the reservoir, the timing cannot be known. However, the discussion and estimates of expected breach times highlight the uncertainty that is likely to exist for any real emergency.
Warnings are sent with estimates of expected flood arrival times, but they are highly uncertain. Users should remember when developing the warning and evacuation parameters that in real-life, the emergency managers do not have a hydrograph of the event post-fact. They are making decisions with limited information.
Imminent Hazard Identification Time
Definition of Imminent Hazard Identification Time
Imminent hazard identification time is the parameter that links the warning and evacuation process to the hydraulic data. Imminent hazard identification time is the point in time at which someone (typically the dam or levee owner) recognizes that a life-threatening flood is going to occur or is occurring and determines that the PAR needs to be evacuated (see Figure).
An example is the point in time when an inspector becomes aware that a dam is overtopping and eroding rapidly. In this case, an early imminent hazard identification may be possible if the overtopping and erosion could be forecasted, or late if it was unexpected and no one was on-site to witness it.
The imminent hazard identification time may occur before or after the hazard occurrence time (i.e., to the left or the right of hazard occurrence time on the LifeSim timeline). Thus, it may be positive or negative. A positive time indicates a late identification, made after the hazard has occurred. A negative time (before the hazard occurrence) indicates an early identification of the hazard.
The imminent hazard identification period typically includes:
-
Observation of an abnormal condition that would lead someone to consider a flood and/or failure may be imminent. The observation may be:
- A physical observation by a person (i.e., seepage)
- A forecasted condition (extreme incoming flood likely to exceed design capacity)
- An unexpected change in a monitored gage (e.g., embankment deformation, flow, seepage)
-
Recognition that the observation is indicative of an imminent flood hazard. For example, understanding the implications of the observation, e.g., "will this seepage lead to a breach?"
-
Recognition that people may be in harm’s way and need to be evacuated.
-
Sufficient confidence in the assessment to alert the authority responsible for evacuation.
The imminent hazard identification time parameter can be defined with uncertainty in LifeSim. The uncertainty includes considerations of when something might be observable, is someone there to see it, is there a technical understanding of the severity of the observation/forecast, how long does the process of failure take before the hazard occurrence (breach initiation time).
Research and Development
The imminent hazard identification time is one of the most important and sensitive factors impacting total life loss. It is an area that includes several tracks of ongoing research. One area is on physical modeling of breach progression, especially for embankment erosion that is advancing with laboratory experiments and software development. Robin Fell and others (2003) [?] have documented the amount of time it takes for embankments of different materials to progress from a visible leak to breach. ERDC (Robbins and Wibowo, 2012) [?] are experimenting with backward erosion piping progression. USDA ARS developed an empirically based software called WinDAM C that models breach progression of embankments undergoing internal erosion or overtopping erosion (Morris et al., 2018) [?]. Dr. Wu developed a software that simulates the physics of breach development called DLBREACH, collaborated and implemented into HEC-RAS. The HEC-RAS version of DLBreach combines the breach development algorithms from Wu (2013) [?] with HEC-RAS hydraulics. HR Wallingford developed models based on Dr. Wu’s research that simulate the physical process of breach progression (HR Breach, EMBREA) (Risher and Gibson, 2016) [?]. A detailed analysis of the imminent hazard identification may include sampling of the embankment material for erodibility properties and modeling with one of the breach models to understand the uncertainty around the breach progression time.
Another area is the decision-making process for the owners of flood management infrastructure. The lack of physical understanding and/or ability to observe the breach process must figure into the decision-making time. The lack of understanding limits the ability for early detection until the observable signs present overwhelming evidence that a problem may progress to a breach. When evaluating the hazard identification time, the analyst should also consider the presence or absence of monitoring equipment, staffing, and inspection protocols. Early observation of a changing condition by personnel or instrumentation may allow an imminent hazard to be identified sooner and reduce the hazard communication delay.
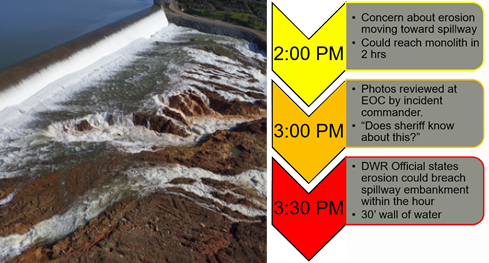
An example of imminent hazard identification is shown in Figure from the 2017 Oroville Spillway incident. It shows that 90 minutes elapsed from the time observers became concerned about erosion on the spillway to the time that officials identified a potential spillway breach.
Other historic events exist where the hazard identification time has been documented, as summarized in Table. The historic case histories help highlight the differences between when the hazard is initially observed and when the decision is made to begin the evacuation process.
| Event | Failure Type | Initial Observation Time | Imminent Hazard ID Time | Failure Time |
|---|---|---|---|---|
| Teton Dam | Seepage, first filling of dam | June 5, 1976 7:00 AM, slightly turbid leakage noted | June 5, 1976 ~10:43 AM, decision to call county sheriff and notice given to begin evacuation | June 5, 1976 11:55 AM, crest collapses |
| Laurel Run Dam | Overtopping | None, not even flash flood warnings until after failure | None, no one was present at the dam | July 20, 1977 2:35 AM |
| Canyon Lake | Overtopping | June 9, 1972, severe thunderstorms and flash flood warnings | June 9, 1972 ~10:39 PM, decision to evacuate | June 9, 1972 ~10:45 PM |
| New Delhi Dam | Overtopping | July 24, 2010 3:30 AM, vortex noted 40 to 50 feet south of structure | July 24, 2010 ~10:29 AM, emergency managers ordered evacuation | July 24, 2010 1:00 PM |
| Kelly Barnes Dam | Unknown | None, unmanned dam | None, no one was warned | November 6, 1977 1:30 AM |
| Oroville Dam | Spillway failure | February 12, 2017 ~2:00 PM, concern about the rate of erosion headcutting toward the emergency spillway | February 12, 2017 ~3:30 PM, rate of erosion downstream headcutting toward the emergency spillway was more rapid than expected and an evacuation was deemed necessary | N/A |
Hazard Communication Delay
Definition of Hazard Communication Delay
The hazard communication delay is the period of time from the imminent hazard identification time to notifying the agency responsible for ordering an evacuation (e.g., emergency management agency) (Figure). The hazard communication delay may include the time needed to:
- Locate a phone or phone number.
- Find alternative modes of communication if standard communication options are unavailable.
- Complete internal agency reporting or emergency protocol.
- Obtain approval to notify the EMA.
- Collect information needed by the EMA.
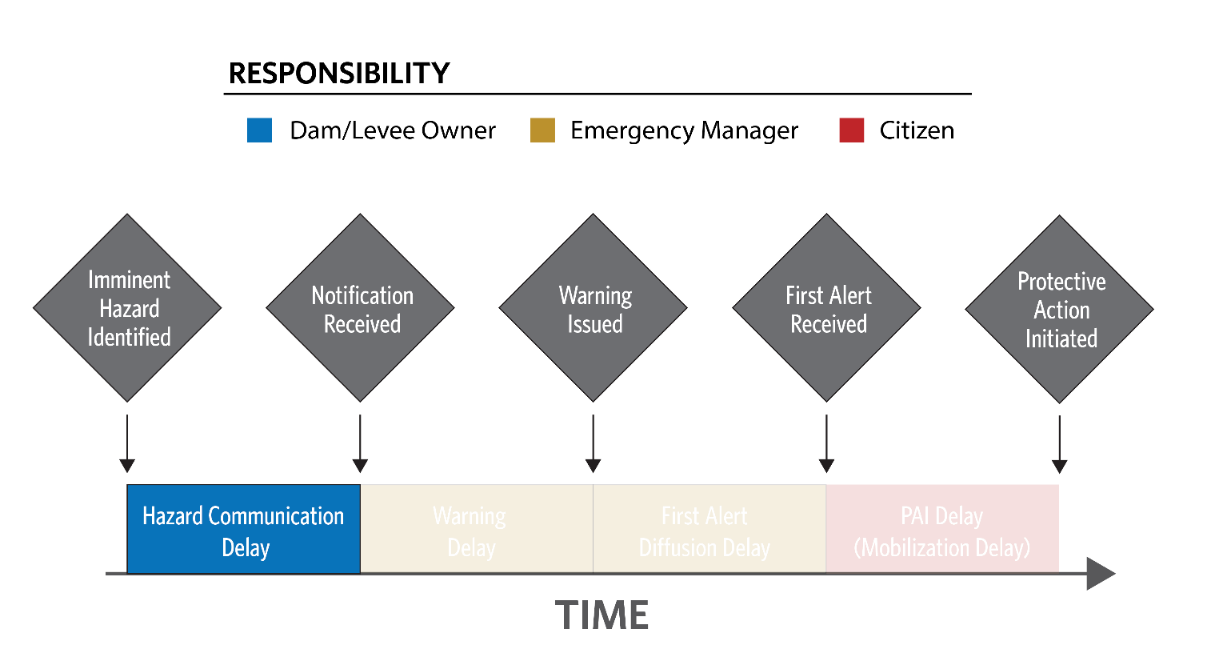
Confusion and indecision may introduce uncertainty due to lack of planning for such an event. There may be uncertainty in time required for any of the activities above.
The user (1) defines the hazard communication delay after the imminent hazard time has been identified, and (2) defines the distribution of the uncertainty (if modeled). The definition is made for each EPZ in each alternative. Hazard communication delay can be zero if the EMA is the hazard identifier or they are co-located in an incident command center.
Research and Development
Staff at the Oroville Incident Command Center recalled in interviews that California Department of Water Resources (DWR) geologists observed erosion nearing the emergency spillway around 2:00 PM. They continued to monitor it, collected information, and brought it to the incident command center around 3:00 PM.
During discussions of the situation, around 3:30 PM, the Butte County sheriff overheard DWR staff wonder aloud, "Is the sheriff aware of this?", serving as his notification. The delay was longer for other jurisdictions not represented at the incident command center that were notified later – either by the sheriff, the Butte County warning issuance, or Blackboard Connect, as shown in Table (Sorensen et al., 2018) [?].
| EPZ | Imminent Hazard ID Time | Notification Time | Hazard Communication Delay (min:sec) |
|---|---|---|---|
| Butte County | 3:30 PM | 3:30 PM | 0:00 |
| Sutter County | 3:30 PM | 5:00 PM | 1:30 |
| Yuba City | 3:30 PM | 4:30 PM | 1:00 |
| Yuba County | 3:30 PM | 4:00 PM | 0:30 |
The dividing line between imminent hazard identification time and hazard communication delay is somewhat blurred in this example due to uncertainty in the integrity of materials near and below the structure. Geologists recognized an issue at 2:00 PM but may not have been convinced of its severity, a requirement for imminent hazard identification. They did consider it serious enough to alert superiors and collect more information, two of the factors noted above. Had the sheriff not overheard the conversation, the delay may have been extended further or not even resulted in a notification.
Warning Issuance Delay
Definition of Warning Issuance Delay
As used in this context, a "warning" is a message intended to instruct recipients to take a protective action – that is, to evacuate. It is the first public alert of an evacuation order. The term "warning" also does not include any messages about the hazard that may have been issued prior to an evacuation order.
The warning issuance delay, shown in Figure, is the time that elapses from the moment the agency issuing the warning first learns of the hazard to first release of an evacuation notice. Warning issuance delay does not include issuance of pre-evacuation information.
Factors that influence warning issuance delay include:
- Identification of the PAR.
- Understanding, confirming, and describing the hazard.
- Understanding and describing the potential consequences.
- Crafting an evacuation message.
- Accessing the first channel of communication.
- Obtaining authorization to release an evacuation order.
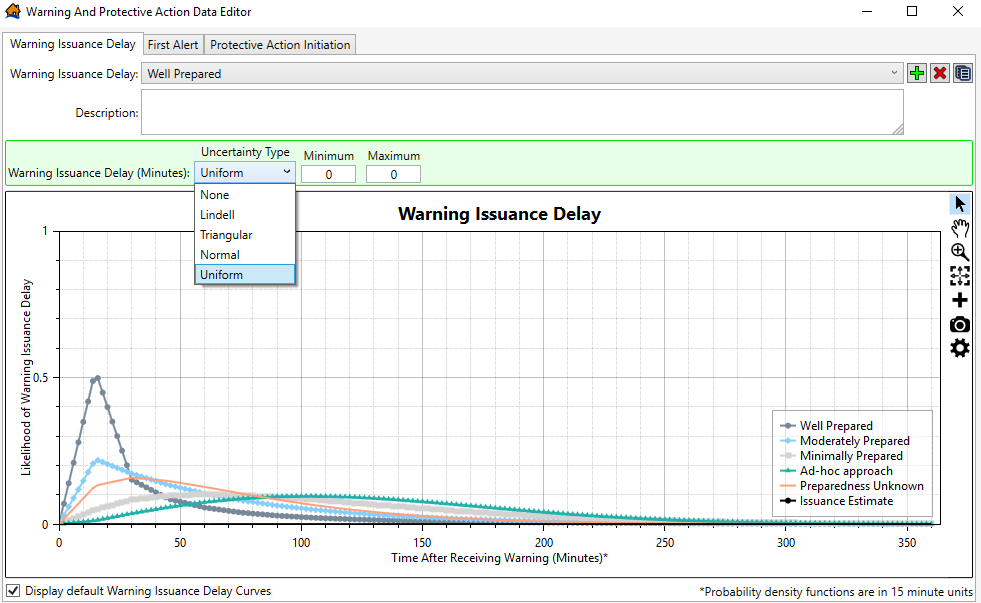
The analyst must decide whether to use one of the default functions that LifeSim provides, or use a custom function. To make this decision, the analyst must gather information about the hazard response and warning protocols in place at the EMA for the study area and make qualitative judgments about those factors. If none of the provided default functions appear appropriate, the user is able to develop a custom function with the help of elicitation using the Expert Opinion Elicitation (EOE) Questionnaire in Appendix B. If the user has no information, use of the Preparedness: Unknown function is recommended. The standard warning issuance delay functions are shown in Figure.
To develop a custom function (using the Add New  button
shown in Figure), USACE has developed a warning and
mobilization function generator in Excel. The first tab in this tool is the EOE questionnaire, also provided
in Appendix B. Many questions from this
elicitation help the user gather information about the first alert diffusion function. The elicitation helps identify the level of preparedness of the
EMA.
button
shown in Figure), USACE has developed a warning and
mobilization function generator in Excel. The first tab in this tool is the EOE questionnaire, also provided
in Appendix B. Many questions from this
elicitation help the user gather information about the first alert diffusion function. The elicitation helps identify the level of preparedness of the
EMA.
The function generator tool scores the answers to the questions and generates values for the a and b parameters of the Lindell function (Equation).
This, in turn, defines the shape of the custom warning issuance delay function. More information about EOE and scoring results is provided in Appendix B.
Research and Development
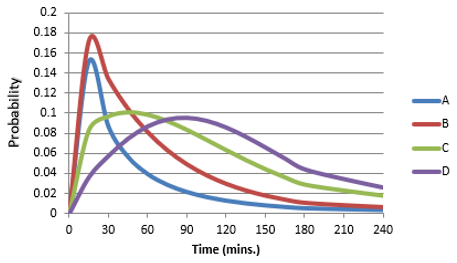
Research conducted by Mileti and Sorensen (2017a) [?] was used to determine how different factors may affect the warning issuance delay during an evacuation. The researchers reviewed historical case studies of disaster warning issuance and identified four main categories of factors that impacted the speed at which emergency managers made warning decisions:
- Formalization of planning and implementation procedures
- Staff experience/training and interpersonal relations
- System performance factors
- Situational factors
The researchers developed functions to estimate warning issuance delays based on surveys of emergency managers. Delay times were based on both the emergency manager’s estimation of a hypothetical scenario as well as actual delay times from previous warning issuances, specifically 70 cases of chemical accidents and releases. Four different probability distribution functions were developed, shown in Figure. LifeSim warning issuance delay times are largely based on work by Mileti and Sorensen (2017a) [?].
For the 2017 Oroville Spillway incident, DWR communicated a warning message to other organizations via Blackboard Connect about the developing emergency spillway situation and to immediately evacuate at 4:10 PM on February 12, 2017. Following this warning, five first public warning messages (from different EMAs) were issued to different counties and at-risk areas, including Butte County, Sutter County, Yuba County, and Yuba City. A summary of the first public warning evacuation messages is shown in Table (Sorensen et al., 2018) [?].
| EPZ / At-Risk Areas | Notification Received | Warning Issued | Warning Issuance Delay (min:sec) | EMA |
|---|---|---|---|---|
| Butte County | 3:30 PM | 4:21 PM | 0:51 | Butte County Sheriff |
| All three counties at-risk | 4:10 PM | 4:35 PM | 0:25 | National Weather Service |
| Yuba County | 4:00 PM | 5:33 PM | 1:33 | Yuba County Office of Emergency Services |
| Sutter County | 5:00 PM | 6:03 PM | 1:03 | Sutter County Office of Emergency Management |
| Yuba City | 4:30 PM | 6:49 PM | 2:19 | City officials |
First Alert Diffusion Delay
Definition of First Alert Diffusion Delay
In LifeSim, first alert diffusion delay (alternatively known as warning diffusion) – shown in Figure – is the relationship that defines how quickly the first alert (warning) will disseminate through the population. Receipt of a first alert encompasses any means by which such a message is received, including official notifications on television or radio, alerts received on mobile phones, local authorities with loudspeakers, family and friends calling one another, and neighbors knocking on doors. Receipt of a first alert does not imply that the recipient understands the content of the message; receipt only indicates awareness that something out of the ordinary is happening.
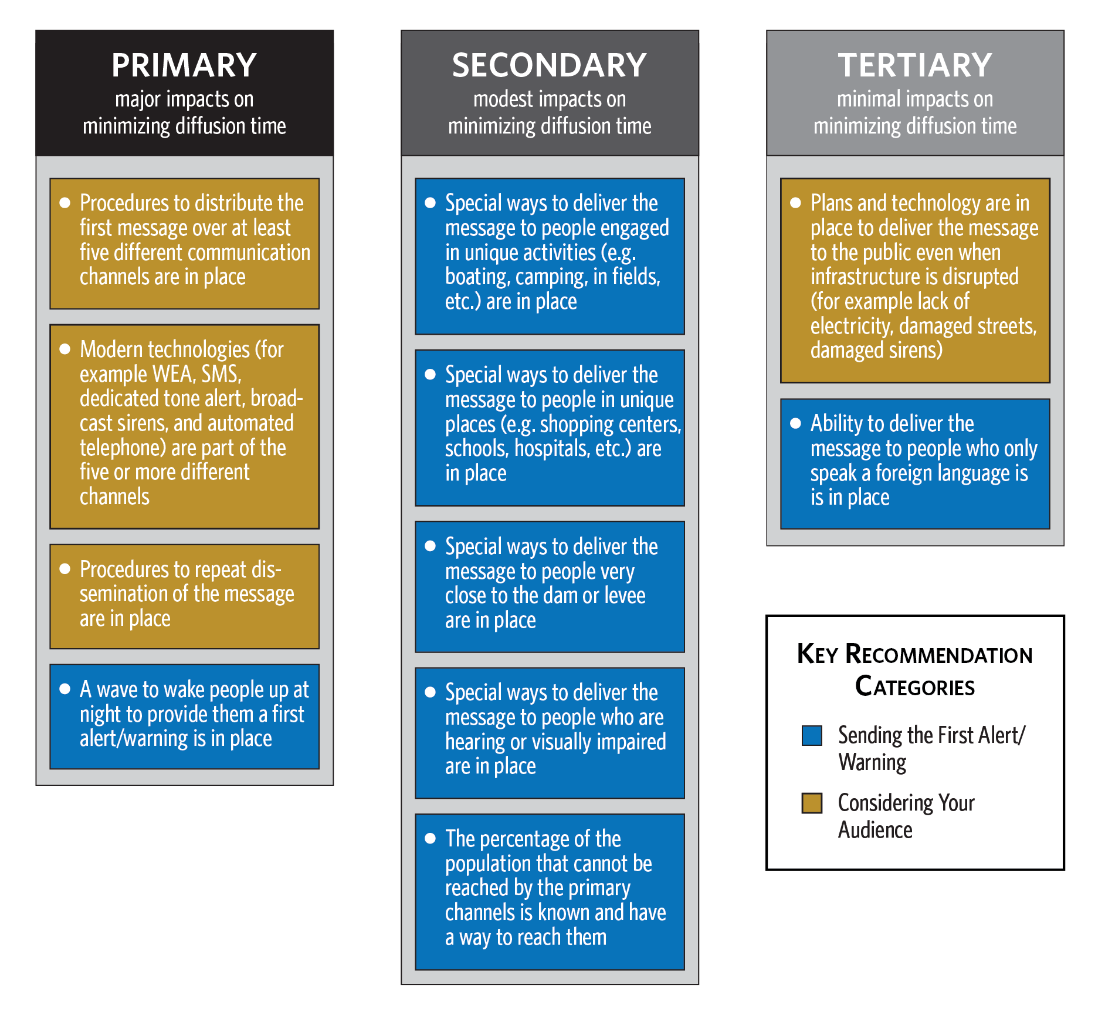
To define the first alert diffusion function in LifeSim, the user has to select one of the dissemination speed functions provided or develop a custom function. The best approach to use will depend on the level of effort available for the study. If no effort can be put into understanding the factors that go into how quickly a warning will spread throughout a community, then the unknown default option should be selected. For minimum efforts, an appropriate default function can be selected by comparing the scenario being studied to the summary of factors influencing first alert diffusion speed shown in Figure. If the level of effort is moderate to high, the user can perform an EOE with the EMA(s) using the questionnaire in Appendix B.
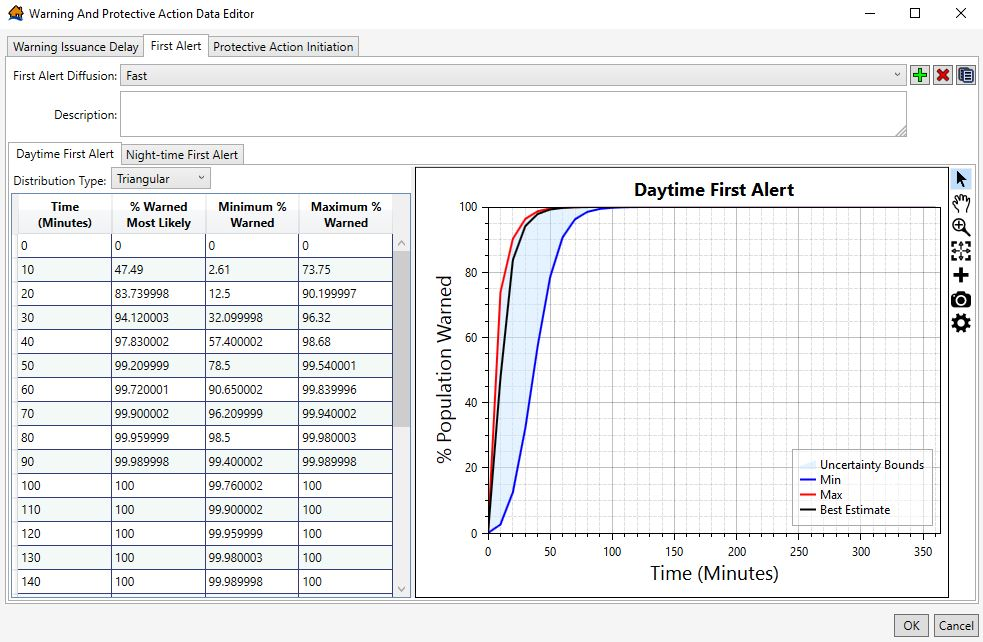
The first alert function is entered for both daytime and nighttime scenarios in LifeSim as an empirical curve function. The curve function can have uncertainty defined at each ordinate. Sampling the function during a simulation is explained in more detail in Warning Function Sampling. An example of a daytime fast first alert diffusion function used in LifeSim is shown in Figure.
Research and Development
First alert diffusion delay functions used in LifeSim were developed by Mileti and Sorensen (2017b) [?]. The researchers collected data on warning delays and first alert diffusion delays for historical events including floods, hurricanes, wildfires, tornadoes, volcanoes, chemical accidents, and terrorist attacks.
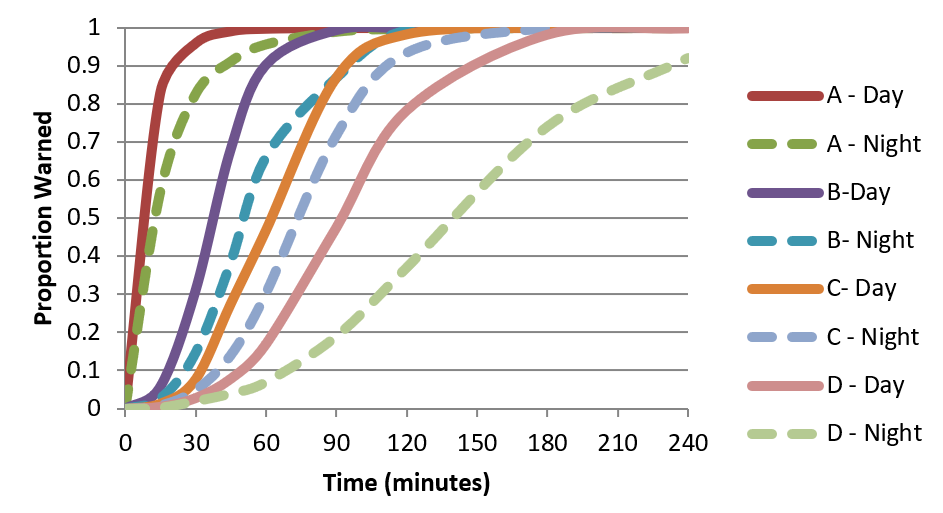
Using data from historical cases and models developed during previous research projects, the researchers developed a total of four first alert diffusion delay functions, shown in Figure.
These functions serve as the default first alert diffusion delay functions in LifeSim, with function A corresponding to the "Fast" first alert function and curve D corresponding to the "Slow" first alert function and so on. The researchers also adjusted the functions to account for time of day, resulting in a total of eight first alert diffusion functions. More information on first alert diffusion delay functions, how they were developed, and how they were incorporated into LifeSim may be found in Mileti and Sorensen (2017b) [?]. If minimal information is available, the user can select from one of the eight default functions in LifeSim.
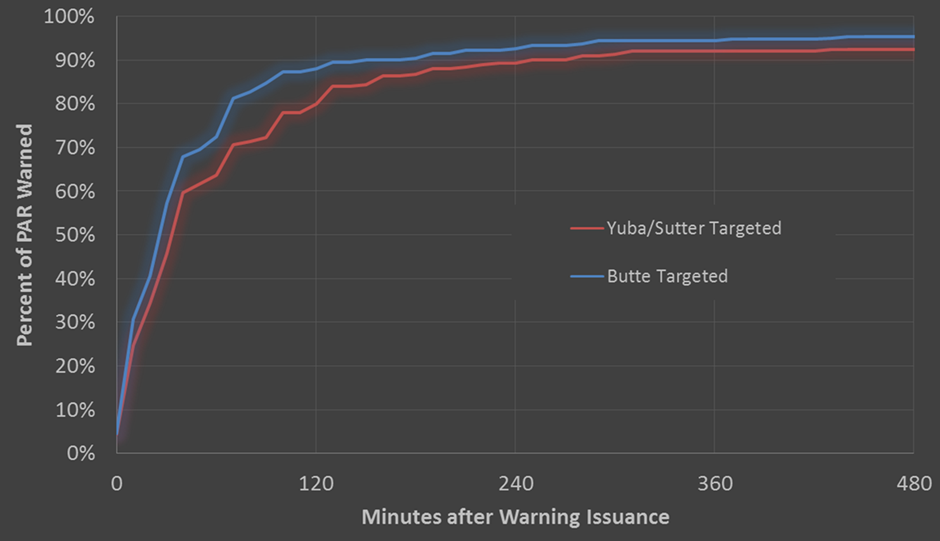
For the 2017 Oroville Spillway incident, around 86% to 89% of the PAR received a warning on February 12, 2017 (Figure). The first warning message was received via text messages, television, phone calls from others, face-to-face communications, and internet/social media. From the time the first warning was issued to when the majority of the population received the first alert was within six hours for the EPZs (Sorensen et al., 2018) [?].
Protective Action Initiation Delay
Definition of Protective Action Initiation
Protective action initiation (PAI) is any action taken by an individual or group to protect themselves. PAI delay, shown in Figure, is the period of time that starts with receipt of the first alert and ends when the recipient of the first alert takes protective action against the hazard. During this period of time, people are confirming the severity of the situation, packing, notifying others, protecting property, gathering family and pets, etc.
PAI delay is important in two different evacuation scenarios. First, if little time is available before the arrival of water, people need to take protective action quickly if they are going to have enough time to reach safety. The second scenario where the PAI delay is important is when there is ample warning time. In this case, the maximum mobilization rate becomes one of the most sensitive parameters in the model.
The maximum mobilization rate is not a user-defined parameter but is represented by the upper asymptote of the PAI function. It typically ranges from 5% to 20% but could be more under certain conditions. As discussed during the Oroville incident and documented in many other historic flood events, not everyone will evacuate even if ordered to and given enough time. Emergency managers are usually aware of this population and may be able to provide an estimate. Effective messaging is the best way to reduce the number of people remaining behind.
In LifeSim, the start of protective action means "starting to move away from the area of potential flooding towards emergency shelters or other safe destinations" (Aboelata and Bowles, 2005) [?]. The percentage of population that takes protective action over time is represented by a PAI function (Figure).
The PAI delay function is entered in LifeSim as an empirical curve function. The curve function can have uncertainty defined at each ordinate. Sampling the function during a simulation is explained in more detail in Warning Function Sampling. Here, the function represents protective action only of those that evacuate by leaving the structure, as this mode of evacuation is time-dependent and defined by a delay function. Vertical evacuation is discussed further in Vertical Evacuation Within Structures.
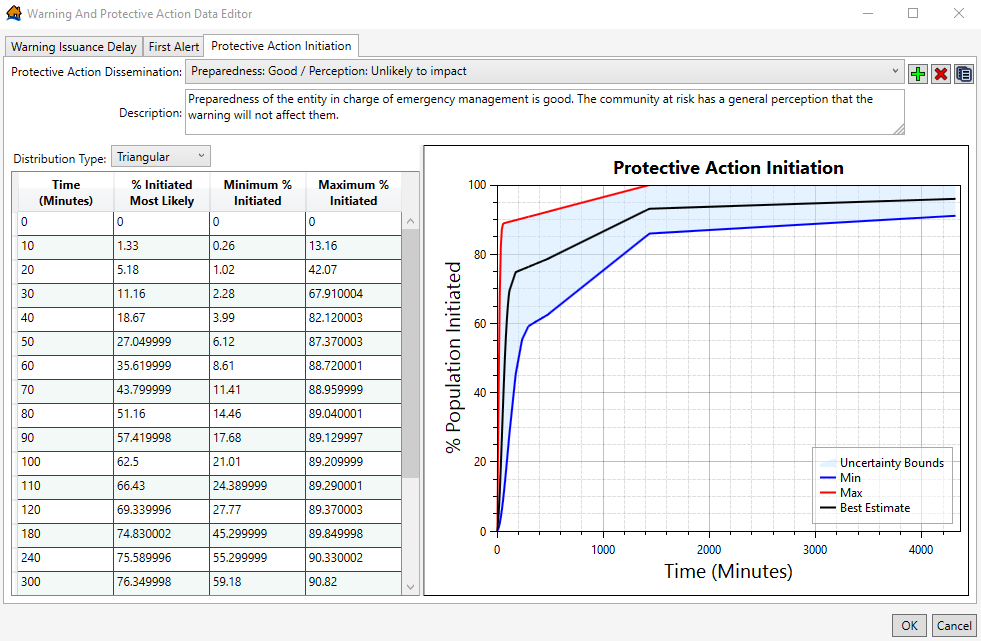
Use of the questionnaire described in Appendix B can help elicit information to determine the correct level of preparedness. If minimal information is available, the user can select from nine default functions in LifeSim based on levels of EMA preparedness and public perception of their risk. Preparedness levels refer to the preparedness of the emergency management agency issuing the warning.
The definitions of preparedness levels are as follows:
- High: The EMA is well-prepared to issue a well-crafted, convincing message that motivates the population receiving the message to act.
- Moderate: The EMA is moderately well-prepared to issue an effective message.
- Low: The EMA is not well-prepared to issue an effective message.
- Unknown: There is little information about the EMA preparation or the agency releasing the warning is unknown. An average condition between low and high is assumed with the full range of uncertainty of both.
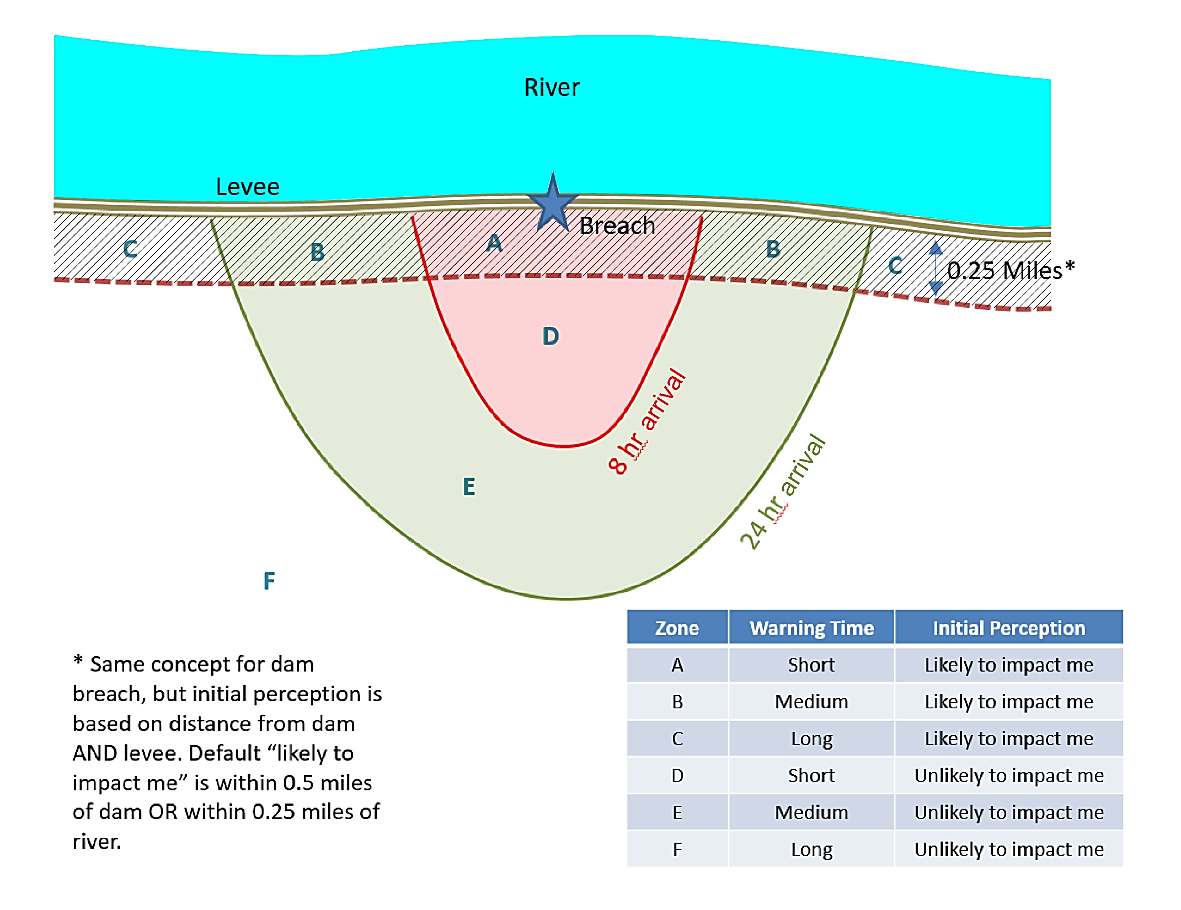
Initial perception refers to the perception of the people receiving the first alert. It is a function of location of the population relative to the hazard. If, for example, the population lives within sight of the dam or river, the initial perception of dam failure is "high." Initial perception can also be influenced by recent events or by extremely effective and pervasive public awareness campaigns.
Suggested definitions of perception levels based on distance from the hazard are as follows:
- High: Population less than 0.25 miles from the river or less than 0.5 miles from the dam.
- Moderate: Population around 0.25 miles from the river or 0.5 miles from the dam.
- Low: Population greater than 0.25 miles from the river or greater than 0.5 miles from the dam.
- Unknown: There is little information about the public perception of flood risk. It is represented with the full range of uncertainty of both low and high perception levels.
Research and Development
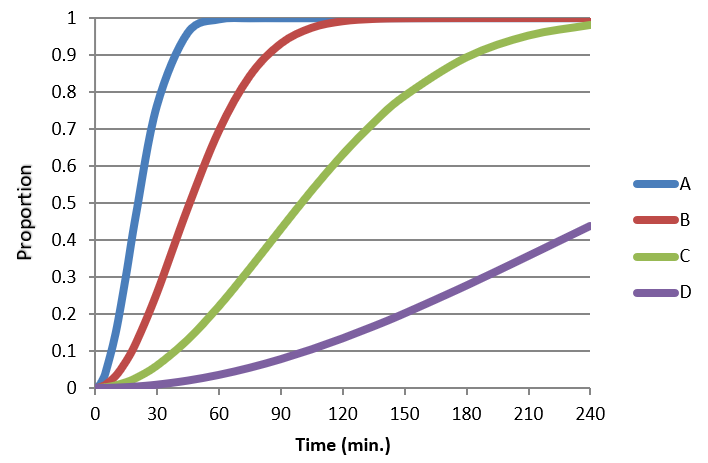
PAI delay functions used in LifeSim were developed by USACE-RMC based on research by Mileti and Sorensen (2017c) [?]. The researchers examined historical cases of protective action in order to derive empirical data about protective action timelines. They developed a mathematical model of PAI that fit the historical cases, resulting in a total of four PAI functions differentiated by perceived level of preparation, shown in Figure. Series A represents a high level of preparation, while series D represents a low level of preparation.
An additional PAI function was developed with rapid initiation to represent those evacuating on foot. More information on the research, development, and implementation of PAI functions for LifeSim may be found in Mileti and Sorensen (2017c) [?]. USACE-RMC expanded the functions from 8 hours to 72 hours to accommodate longer LifeSim simulation times based on assumed mobilization at 24 hours and 72 hours. The best and worst of the four general cases were taken as the limits of uncertainty. The nine default curves are a recombination of these general curves based on assumed weighted answers to the EOE in Appendix B representing risk perception and likeliness to impact (perception). LifeSim users may create their own custom functions based on surveyed answers to the questions.
For the 2017 Oroville Dam Spillway incident, findings showed that most individuals sought additional information by communicating with others via phone calls, face-to-face conversations, or the internet after receiving the first warning message prior to evacuating. Additionally, prior to taking protective action, individuals performed various pre-evacuation activities, including securing their homes or businesses, packing items, reuniting with family members and pets, and helping others prepare to evacuate.
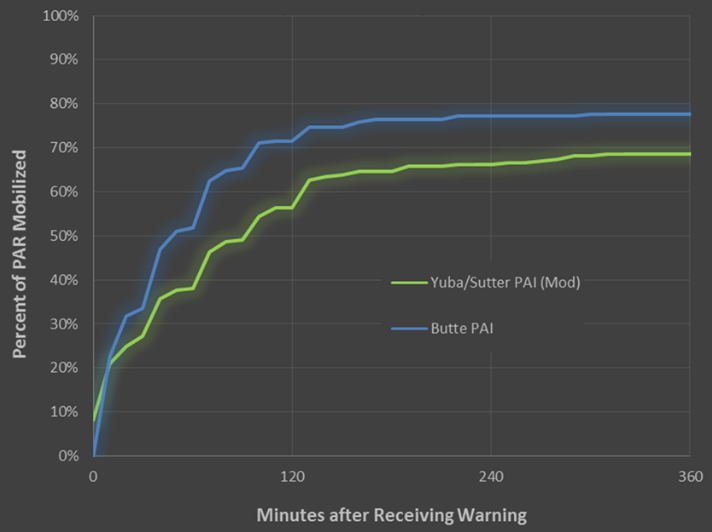
Based on a study survey of the EPZs, around 67% to 68% of the population evacuated and the PAI delay for the majority of the population was around two to three hours (Figure). Some of the population took protective action prior to the warning issuance based on the coverage of the situation for several days and to avoid roadway congestion if an evacuation was issued (Sorensen et al., 2018) [?].
General Modeling Guidelines
- The analyst may find it useful to adopt a zoned approach when defining perception for PAI delay functions. This is because people’s perception of their risk tends to get reduced with distance from the hazard source. An example of a levee breach scenario is shown in Figure. The terminology of "likely to impact" and "unlikely to impact" was updated to "high" and "low," respectively, in LifeSim version 2.1 and later.
-
The default curves may be used in LifeSim for warning issuance delay, first alert diffusion delay, and PAI delay, but many studies would benefit from functions specific to the emergency management agencies responsible for the study region. The EOE in Appendix B is used in conjunction with the Warning Curve Generator developed by USACE-RMC to generate custom functions adapted from the research of Mileti and Sorensen (2017a, b, c) [?] [?] [?].
-
Most EMAs in the United States follow the Incident Command System guidelines as part of the National Incident Management System led by FEMA. The guidelines were developed to be flexible for any type of incident and scalable to include multiple agencies from local to national level. In a large event, warnings and messaging are typically coordinated within this framework. Perhaps because of this organizational and agency posture, incident planning often takes the form of "all-hazards" plans. Agencies want to be ready for any disaster including floods, often to the detriment of flood-specific preparation. Some agencies recognize their unique risk to flooding and have specific planning to address it.
-
Several agencies may have jurisdiction or overlapping responsibility for portions of the warning and evacuation timeline. For example, the chief of police of a city may issue a warning, the county sheriff may issue another, and the National Weather Service or River Forecast Center may also issue notices (but typically stop short of evacuation warnings). People may act on any of the information they deem relevant even without a mandatory evacuation order.
The total population included in the model does not account for people who have evacuated voluntarily prior to warning issuance. While there is no formal method in LifeSim to simulate evacuees prior to the evacuation warning issuance, informal methods may be used to incorporate this into the model. When assigning population to the structure inventory, those that are assumed to pre-evacuate can be removed from the structure inventory. Additionally, the imminent hazard identification time may be manipulated to make the entire warning and evacuation timeline initiate earlier.
Some data exist on evacuation departures prior to an official order (Sorensen et al., 2018) [?]. It may be difficult for citizens to determine if an official order applies to them (Sorensen et al., 2018) [?]. The data from several hurricane events suggest that in protracted warning situations, some people initiate action after the first warning and before what is defined as the official warning. In hurricanes, the number who leave early ranges between 20% and 30% (Baker, 1987; Lindell, Lu, & Prater, 2005) [?] [?]. Early evacuation is most likely to occur if an official warning is delayed in what appears to be a potentially threatening situation.