

Road Networks, Destinations, and Evacuation Parameters
Chapter Overview
If traffic is being simulated, road network and destination data are required in a LifeSim study to represent possible routes that people can take during an evacuation. The road network features can be categorized into multiple road types with attributes defining their census feature class code (CFCC; see Table), flow direction, and vertical offset. Destination features represent point locations on roads – generally outside of the inundation extents – where evacuating groups travel to, and once they arrive, are assumed safe.
The model simulates traffic along the road network starting with the first evacuating group that initiates protective action. When the evacuation is initiated, the road network does not have vehicles on it. Once a vehicle has entered the road network, drivers are able to make decisions about their route based on computational inputs that include traffic conditions, destination locations, depth on roads, vehicle type, and roadway classification.
Evacuating drivers choose a destination based on the shortest travel time from their current location to a destination. If their path becomes obstructed by either flood water or traffic congestion, drivers alter their path and destination as necessary to evacuate. Once the simulation starts, drivers are aware of where they are on the road network and retain some memory of where they have been. A vehicle will not try to revisit a roadway link that has already been found to be flooded.
Computational Inputs
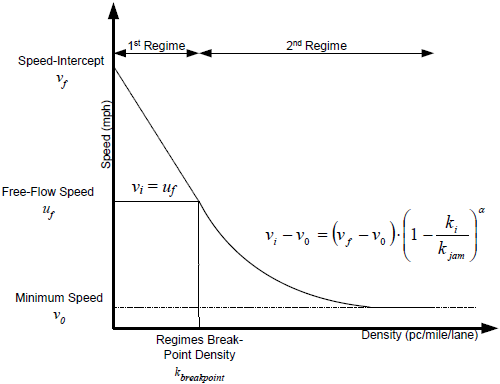
LifeSim uses a modified version of the Greenshields traffic simulation model as shown in Equation, Equation, and Figure to determine speed of vehicles at each time step (Mahmassani et al., 2009) [?]. If density becomes high enough, speeds will begin to reduce. Break point density is the point at which vehicles transition from free-flow speeds to congested conditions and shift to a Greenshields model for speed and density relationships.
where:
vi = speed on link i
uf = free flow speed on link i
ki = vehicular density on link i
kbp = break point density
v0 = stop and go speed on link i
vf = speed intercept
kjam = jam density on link i
α = Greenshields power term
Road Networks
Linework
The linework for the road network is generally imported from a shapefile or directly from the OpenStreetMap web service. OpenStreetMap is a collaborative project to create free editable maps of the world [?]. It is supported by a large community of dedicated members to provide global GIS data. LifeSim can take the road network information stored within the OpenStreetMap database and create a road network. Once the road network data is imported, the user can edit the data by defining one-way fields and vertical offsets.
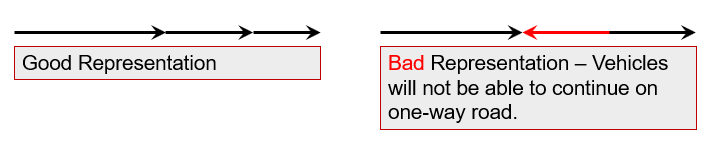
The directionality of one-way roads in the road network is important in LifeSim computations. Direction is determined by the order of the line points, where the first line point is the road entry and the last line point is the exit. Vehicles have unidirectional movement on a one-way road and cannot turn around. Examples of valid and invalid representations of one-way roads are shown in Figure.
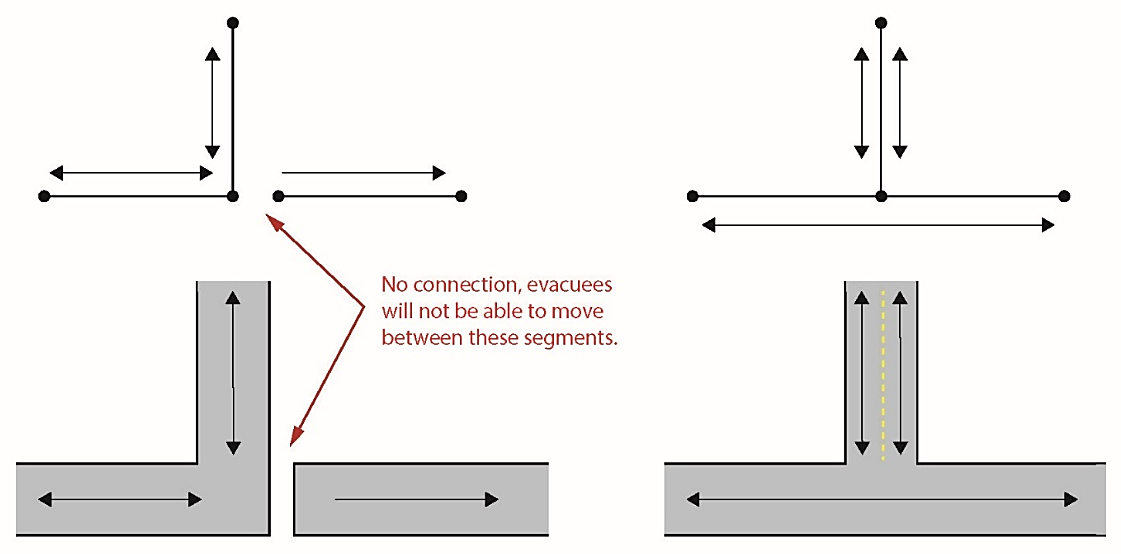
Road network connectivity must be thoroughly reviewed by the user. The road endpoints must be within 2 feet to allow travel from one road segment to the next, as shown in Figure.
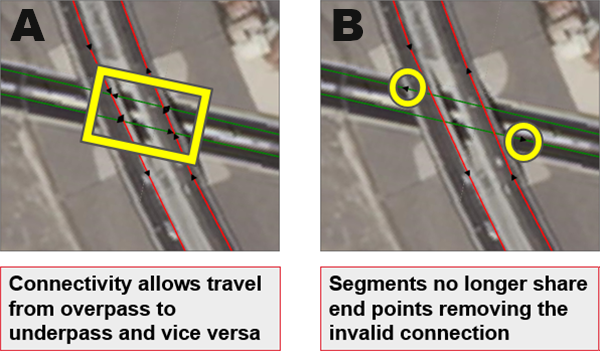
Overpasses can possibly share end points with roads underneath. In Figure(a), vehicles would be able to incorrectly drive from the overpass directly onto the road underneath.
The hydraulic characteristics for a roadway link are sampled at the centroid of the roadway line segment. This means that care must be taken for long roadway segments and steep terrain as the midpoint may not be a representative condition for hydraulics. An example of where the midpoint should be modified is shown in Figure.
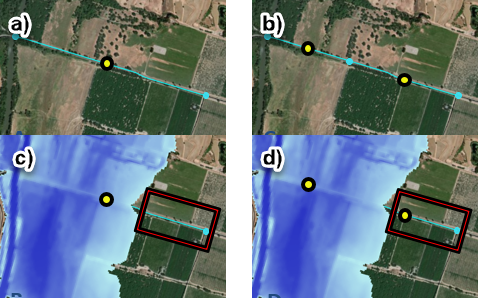
In Figure(a), the road segment is long. If the hydraulic results are sampled at the centroid of the road segment as shown in Figure(c), the depth would be poorly represented in the first half of the road segment. If the same road segment is subdivided as shown in Figure(b), then the hydraulic representation would be more accurate Figure(d).
Roadway Vertical Offset
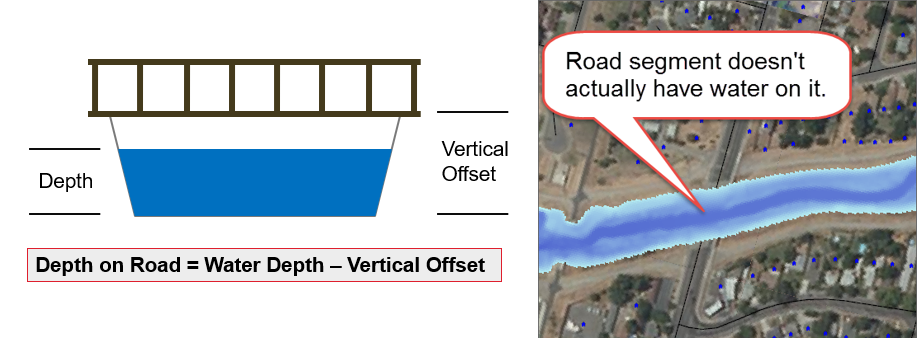
The vertical offset accounts for roads with elevations higher than the underlying terrain (e.g., bridges, overpasses, causeways). If the roadway is an overpass, then the vertical offset should be set to underlying terrain plus the height to the overpass roadway. Bridge segments typically have their midpoint over the channel and require vertical offsets to allow traffic to continue over the bridge without being impacted by the water flowing underneath. A schematic of a bridge vertical offset is shown in Figure.
Road Classification Data
Roads are classified in LifeSim using census feature class codes (CFCC). CFCCs for roadway features are summarized in Table.
| Value | Description |
|---|---|
| A10-A19 | Primary road with limited access or interstate highway, unseparated or separated |
| A20-A29 | Primary road without limited access, U.S. and state highway, unseparated or separated |
| A30-A39 | Secondary and connecting road, state and county highways, unseparated or separated |
| A40-A49 | Local, neighborhood, and rural road, city street, unseparated or separated |
| A50-A53 | Vehicular trail, road passable only by 4WD vehicle |
| A60 | Special road feature, major category used when the minor category could not be determined |
| A61 | Cul-de-sac, the closed end of a road that forms a loop or turn around |
| A62 | Traffic circle, the portion of a road or intersection of roads that form a roundabout |
| A63 | Access ramp, the portion of a road that forms a cloverleaf or limited access interchange |
| A64 | Service drive, road that provides access to businesses |
| A65-A67 | Ferry crossing, the representation of a route over water that connects roads on opposite shores, passenger or vehicular |
| A68 | Toll booth barrier to travel |
| A70 | Other thoroughfare |
| A71 | Walkway, nearly level road for pedestrians, usually unnamed |
| A72 | Stairway, stepped road for pedestrians, usually unnamed |
| A73 | Alley, road for service vehicles, usually unnamed, located at the rear of buildings and property |
| A74 | Driveway or service road, usually privately owned and unnamed, used as access to residences, etc., or as access to logging areas, etc. |
| A75 | Parking area |
The road classification attribute CFCC helps define common road parameters such as number of lanes, free flow speed, traffic jam density, break point density, stop and go speed, and a Greenshields power term. When the user has a non-typical roadway type (for example, a highway that is 5 lanes), users may need to create and define a new CFCC or edit an existing code as necessary to fit the individual situation (for a 5-lane highway example, the user could set the type to A11 Primary road with limited access or interstate highway, unseparated, and set the number of lanes to 5 lanes). The existing CFCC codes used in the LifeSim model are defaults but can be edited. However, caution should be used prior to changing these parameters as they have a significant impact on the traffic simulation. Road classification data defaults in LifeSim are shown in Table.
| CFCC Range | # of Lanes | Free Flow Speed (mph) | Jam Density (Vehicles/ Mile) | Break Point Density (Vehicles/ Mile) | Stop and Go Speed (mph) | Greenshields Power Term |
|---|---|---|---|---|---|---|
| A10 - A19 | 3 | 65 | 160 | 28 | 4 | 2.5 |
| A20 - A29 | 2 | 55 | 160 | 23 | 4 | 2 |
| A30 - A39 | 2 | 45 | 160 | 23 | 4 | 2 |
| A40 - A49 | 1 | 35 | 160 | 14 | 4 | 1.5 |
| A50 - A68 | 1 | 25 | 160 | 5 | 4 | 1.5 |
| A70 - A75 | 1 | 4 | 90 | 5 | 4 | 1.5 |
These values can be manually adjusted by the user for each individual CFCC. Table describes the CFCC defaults, best practices for selecting values, potential source data, and sensitivity of values to LifeSim results.
| Parameter | Definition | Default | Sensitivity to Results |
|---|---|---|---|
| Number of lanes | The number of lanes going in same direction. | 1 - 3 | High |
| Free flow speed | The free flowing speed of vehicles on the road with no impediments. | 4 mph - 65 mph | High |
| Jam density | The density of vehicles per mile required to create traffic jam conditions. | 90 vehicles per mile (vpm) or 160 vpm | Low |
| Break point density | The density of vehicles required to start impacting the overall speed. | 5 vpm - 28 vpm | Moderate |
| Stop and go speed | The speed that vehicles travel when under stop and go conditions. | 4 mph | Medium-High |
| Greenshields power term | Parameter used to help define the relationship between speed and density of vehicles on the road network. | 1.5 - 2.5 | Low |
Free Flow Speed
Free flow speed is the speed at which vehicles will travel when unimpeded by other vehicles. Values can be developed by roadway segment based on field-collected data. If speed studies are not a viable option, assumed speeds can be developed based on the posted speed limit for roadway segments. This value should be user-defined for each roadway type as it will impact model results.
Jam Density
As congestion begins to build on the roadway, vehicles will begin to form queues. The jam density is the theoretical density when traffic flow begins to approach zero. The Highway Capacity Manual states, "Jam density does not affect throughput, it only influences the formation and dissipation of queues at bottlenecks. Interestingly, an increase in the jam density value reduces both the forming and recovery wave speeds. The opposite situation occurs if jam density is decreased, in which case both the forming and recovery speeds will increase" (TRB, 2016) [?].
Break Point Density
Break point density is the point at which vehicles transition from free-flow speeds to congested conditions and shift to a Greenshields model for speed and density relationships. In general, the break point density should not need to be modified for local conditions.
Stop-and-Go Speed
Stop-and-go speed is the speed that vehicles will travel when traffic jam conditions have been met. Stop-and-go speeds generally range between 1 and 15 miles per hour (mph), with 5 mph being the general guideline for standard rush hour traffic. However, during an evacuation, other conditions such as higher-than-average load on the network and weather can further reduce stop-and-go speeds. Therefore, a default of 4 mph has been specified.
Greenshields Power Term
The Greenshields Power Term (α) defines the shape of the speed-density function. The Greenshields power term helps define the functional speed-density relationship between break point density and stop-and-go speed. If the power term is 1, the function will be linear.
Destinations
Destination points represent evacuation locations where the population is safe, specified either within the inundation area or an area outside the maximum flooding extents. People are considered safe and are removed from the simulation once a destination is reached. Destinations are located only on roads. However, the destination does not have to be directly on a road as LifeSim will calculate the nearest road segment to a destination. The user should use judgment when placing destinations such that they are:
- Equidistant from the target population since agents pick destinations based on shortest travel time
- Located at major exit roads
- Sufficiently far away from the population at risk to allow for traffic backup due to limited egress
At the start of the evacuation process, evacuating vehicles select a destination with the shortest travel time. The vehicle will continue toward that destination until it meets a roadway that is flooded or congested, at which point it may re-route. A vehicle that re-routes may choose to change its destination if another can be reached in less time.
Vehicle Stability Criteria Defined By Alternative
The reaction of vehicles to water is simplified into two groups in LifeSim: high clearance and low clearance vehicles. Generally, high clearance vehicles are considered as trucks or SUVs, and low clearance vehicles are considered as cars and vans. In low-velocity, moderate-depth water, most modern vehicles will begin to float because they are mostly water tight. This begins around 18 inches deep for small vehicles and 24-30 inches for larger vehicles. Many times, a vehicle will stall before losing stability, encouraging many people to exit their vehicles and continue on foot.
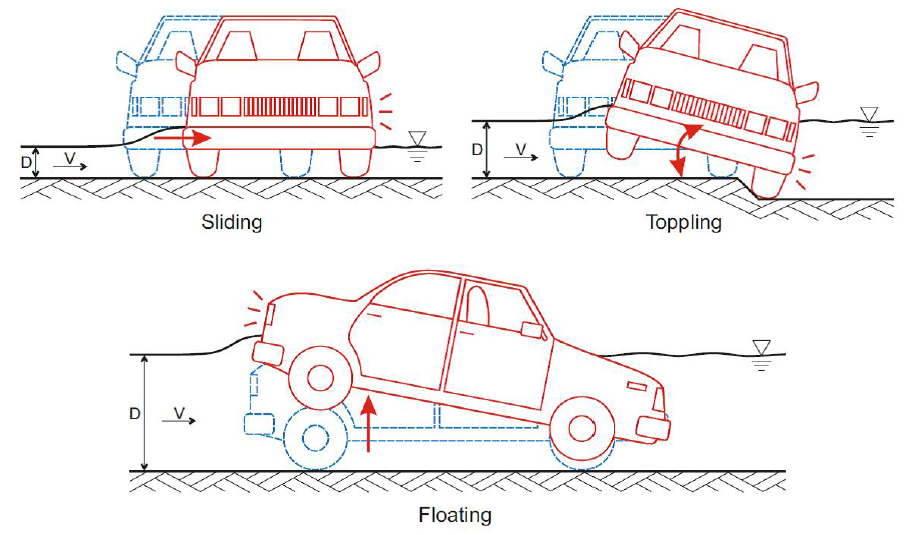
Current understanding based on review of historic events is that vehicles are pushed into deeper and/or faster water after stability is lost. This is a dangerous situation whether the person exits the vehicle or not. Roadways are typically elevated on an embankment, which causes flow to be much faster near the downstream edge of the roadway embankment. More information on factors that impact vehicle stability has been detailed in Appendix G.
When the flooding conditions on a road segment exceed the stability criteria for a vehicle, only the vehicle that loses stability is considered to be "trapped." The trapped evacuees in the caught vehicle are assigned to the least favorable flood zone based on all combinations of flood depth and velocity on the road segment occurring during the simulation period and the stability criteria for their evacuation mode.
The default functions in LifeSim for low- and high-clearance vehicle stability are shown in Table (meters) and Table (feet). For more information on how the defaults were selected, see Appendix G.
| Hydraulic Threshold | Low Clearance Vehicles | High Clearance Vehicles | ||||
|---|---|---|---|---|---|---|
| Low | Best Estimate | High | Low | Best Estimate | High | |
| Depth (m) | 0.3 | 1.2 | 1.5 | 0.5 | 1.5 | 2 |
| Velocity (m/s) | 3 | 4.5 | 6 | 3 | 6 | 6 |
| DV (m2/s) | 0.3 | 0.8 | 1.3 | 0.6 | 1.2 | 2.4 |
| Hydraulic Threshold | Low Clearance Vehicles | High Clearance Vehicles | ||||
|---|---|---|---|---|---|---|
| Low | Best Estimate | High | Low | Best Estimate | High | |
| Depth (ft) | 1.0 | 3.9 | 4.9 | 1.6 | 4.9 | 6.6 |
| Velocity (ft/s) | 9.8 | 14.8 | 19.7 | 9.8 | 19.7 | 19.7 |
| DV (ft2/s) | 3.2 | 8.6 | 14.0 | 6.5 | 12.9 | 25.8 |
Evacuation Parameters Defined by Alternative
In LifeSim, some evacuation parameters are specified by the alternative model component. Table describes the various evacuation parameters, potential ranges for each, and the impact they have on the model outcome.
| Parameter | Default | Range (Best Practice) | Source Data / Considerations | Sensitivity to Results |
|---|---|---|---|---|
| Pedestrian Speed | 4 mph | 2-5 mph | Default is brisk walking speed. 3.5 ft/s (2.4 mph standard in traffic models). Ability, terrain, distance, motivation, loads | Depends on % of evacuees on foot. Could be significant |
| Fraction in Cars vs SUVs/Trucks | 0.5 | 0-1 (higher in rural areas) | Region specific. Impacts driving through flooded road decision making | Low |
| Fraction Who Reroute in Jam | 0.8 | 0-1 | Expert judgment, knowledge of road network | High for congested networks with multiple egress routes |
| Vehicle Look-Forward Distance | 1,320 ft | Dependent on evacuation time step | Expert judgment. Consider distance traveled in single evacuation time step as a minimum | High |
| Effective Vehicle Length | 20 ft | 20-25 ft | Considers buffer length in congested traffic. Only applies when vehicular spillback is enabled | Low |
| Non-Evacuation Depth | 2 ft | 0-3 ft | Decision to leave a structure. Calculated at structure, not road in front of structure | Low |
| Evacuation Time Step | 10 sec | 1-30 sec | Look ahead. Accuracy vs run time | High |
| Live Traffic Update Interval | 5 min | 1-10 min | Runtime. No need to capture full network congestion every time step. (Roughly simulates Waze or Google traffic information available to drivers) | Low |
Pedestrian Speed
Pedestrian speed is set to 4 mph by default. The Manual on Uniform Traffic Control Devices (MUTCD) for Streets and Highways suggests an average, casual walking speed of 3.5 ft/s (2.4 mph) but states that other factors should be considered. Walking speed can vary greatly based on such factors as physical ability, motivation, carrying load, distance traveled, and terrain. For example, elderly or young people would have a slower walking speed. However, in an emergency situation, it is anticipated that many walking speeds would increase. In reality, there is a wide variability from group to group. A jogging speed is considered in the range of 4 to 6 mph (Healthline, 2018) [?], likely too fast to continue for a distance or while carrying anything. Thus, 4 mph is a reasonable assumption representing a brisk walking speed for an adult applied as an average for the population (U.S. Department of Health and Human Services, 2008) [?].
Fraction in Cars vs SUVs and Trucks
This parameter defines the percentage of people who will be evacuating by cars (low clearance vehicles) versus evacuating in SUVs or trucks (high clearance vehicles). The default for vehicle type is split: half evacuate by car, the other half by SUV or truck. This parameter can be modified by the user. It is understood that in urban areas, a higher volume and percentage of passenger cars would be expected, while in areas that are more rural, mountainous, and less densely populated, a higher percentage of SUVs and trucks would be evacuating. The difference between high and low clearance vehicles is only in their decision to enter flooded roads – the occupant capacity is not considered. Changes to the parameter are only impactful to model results when many vehicles are driving through flooded roads.
Fraction Who Re-Route in Jam
Jam re-route percent is set to a default of 80%. The jam re-route has a range of 0-100 and stands for the fraction of people who will look for faster routes to any destination when confronted with a traffic jam. The percentage is typically dependent on the population’s knowledge of the road network and available alternate pathways to the same destination. If they find the route they are on is the fastest route, they will stay there. The default is not 100% because some people may find themselves in a traffic jam and wait it out. People are more likely than not to consider alternate routes, especially with real-time traffic applications on mobile devices.
Vehicle Look-Forward Distance
One of the parameters in LifeSim is the vehicle look-forward distance; at each time step in the model, the vehicle casts forward a certain distance to determine the density ahead of it for a roadway segment. The calculated density is used to determine the vehicular speed for the time step.
Effective Vehicle Length
The effective vehicle length represents the average length of a vehicle plus a small buffer to account for the space between vehicles in stopped conditions (e.g., a stoplight) (NEITE Technical Committee) [?]. The effective vehicle length is commonly 20–25 ft long. The effective vehicle length parameter is used when vehicular spillback is enabled to determine if a road segment has exceeded physical capacity. For example, if a road segment is 100 ft long and has 6 vehicles on it with an effective vehicle length of 20 ft, then one of those vehicles will need to be moved back in the queue. More information on the queue correction process can be found in Preprocessing the Road Network.
Non-Evacuation Depth
The non-evacuation depth is the depth at the structure where an evacuating group will no longer choose to leave the structure. The default value is 2 ft. During a simulation, prior to an evacuating group taking protective action, the depth is calculated to determine if the non-evacuation depth threshold is exceeded. If the depth at the time of mobilization exceeds the non-evacuation depth, then the evacuating group will not leave their structure and will evacuate vertically.
Evacuation Time Step
Within an evacuation time step, each group that has not yet mobilized and is able to do so since the last time step is loaded onto the road network. All evacuating groups' speeds are calculated, their movement is predicted, and if vehicular spillback is enabled, their final positions are corrected. The longer the evacuation time step, the farther evacuating groups will be able to move without the model recalculating speeds and positions. Note that with a larger time step, the model will not capture traffic density conditions and interactions as well as using a smaller time step. The drawback to using a smaller evacuation time step is increased computation time.
Live Traffic Update Interval
During a LifeSim simulation, if an evacuating vehicle reaches a traffic jam and attempts to re-route, they will find the fastest route given the current traffic loads on the system. The live traffic update interval determines the maximum amount of delay for updating current traffic conditions. During an evacuation, drivers would likely have information from Google Maps, Waze, or other apps that provide drivers real-time traveler information.
Willingness to Enter Flooded Roads
Anecdotal evidence and research suggest that many people are willing to drive through flooded roads. In many flood scenarios, vehicles washed off the road are a significant portion of fatalities. The decision-making process to enter a flooded road is complicated and not well understood. In LifeSim, the maximum depth at which each individual vehicle is willing to ford a road is known as the "fording depth" and is assigned based on a probability density function known as the "willingness to enter flooded roads" function.
For each LifeSim iteration, a vehicle is assigned a random number from 0.0 to 1.0. During an evacuation, that vehicle samples either the high or low-clearance willingness to enter function based on the vehicle type. The corresponding depth defines the fording depth for that single vehicle through the simulated iteration. Each iteration will sample a new random variable for each vehicle. The range of possible fording depths will cover some of the uncertainty from neglecting all other factors. If the vehicle encounters a flooded road with depth greater than that vehicle’s fording depth, it will attempt to turn around. If a one-way or flooded road is also blocking the road behind the vehicle, it may become stuck in that location and subject to the maximum hydraulic conditions.
The body of research and resulting statistics used to inform and develop the willingness to enter functions are summarized in Table. A more detailed summary of the previous research efforts and how they were used to develop the default functions in LifeSim is given in Appendix G.
| Flood conditions | Vehicle Type | % Willing to Enter | Source |
|---|---|---|---|
| 10-30 cm flowing slowly | All types | 84% | Gissing et al., 2016 [?] |
| 10-30 cm flowing slowly | High clearance | 92% | |
| 10-30 cm flowing slowly | Low clearance | 71% | |
| 46 cm (18 in) | Mid-sized car | 8% | Drobot et al., 2007 [?] |
| 46 cm (18 in) | Mid-sized car | 40% | |
| 20 cm (8 in) | Mid-sized car | 43% +/- 5% | Pearson and Hamilton, 2014 [?]; Hamilton, Peden et al., 2016 [?] |
| 60 cm (24 in) | Mid-sized car | 13% +/- 3% |
The default willingness to enter functions in LifeSim for low- and high-clearance vehicles use a truncated normal distribution. Default parameters based on existing research are defined in Table.
| Truncated Normal | Low Clearance | High Clearance |
|---|---|---|
| Mean (cm) | 35 | 52 |
| Standard Deviation (cm) | 20 | 20 |
| Minimum (cm) | 6 | 10 |
| Maximum (m) | 3 | 3 |
The functions are editable through the LifeSim Alternatives dialog box, Evacuation Parameters tab, where the user has the option to see the function defining willingness to enter and change the probability distribution (Figure) for both low and high clearance vehicles.
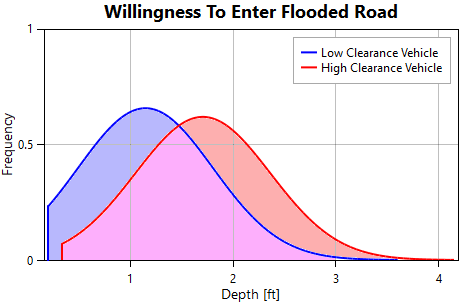
The lower cut off (truncation) of both tails is known as the "puddle depth," which defines the minimum possible fording depth for all vehicles using the function. If a vehicle encounters a flooded road below the puddle depth, it can and will ford the road safely.
Modifications to the default functions could be made by a user with a better understanding of the key factors identified in these studies. Driving a taller versus smaller vehicle is already considered by the two available functions and the ability to alter the proportion of each. Other factors indicating higher likelihood to enter a flooded road can be found in Appendix G.
General Modeling Guidelines
The user should consider the following when populating the model with road networks, destination data, and evacuation parameters:
- Error checking of public data sources. Road network shape information may have been attributed incorrectly or have issues with connectivity.
- Considerations for one-way roads and on-ramps.
- Considerations for bridges and underpasses. Vertical offsets are critical to ensuring proper traffic flow over bridges and raised roadways that would not be impacted by flood waters.
- Vehicle stacking distance.
- Road segments may need to be extended beyond the flooded area to allow for traffic to build up. Cars arriving at a destination leave the simulation, which may not be realistic – especially where services do not exist just beyond the flood zone and vehicles will continue down the road to find them. The backup created by this situation may extend into the flooded area impacting later vehicles' ability to evacuate the hazard.
- For conditions where two freeways merge into one, representing a significant traffic bottleneck, the user would want to extend the roads to after the freeways merge and put a single destination on the merged freeway.
- Smaller evacuation time steps yield more accurate results but also adds burden to the memory and computation time.
- In terms of codifying road segments, many different roadways and separation types exist, making vehicles in the network respond differently. For example, a vehicle traveling in one direction on a two-lane, two-way road where the directions of travel are separated is considered a one-way road where vehicles are not able to turn around if confronted with water and traffic congestion. If the same roadway were coded with a traversable median (i.e., roads with no significant physical barriers between lanes) and if two-way links were coded, cars would be able to turn around.