

Appendix F - Engineered Construction Structural Stability
Engineered
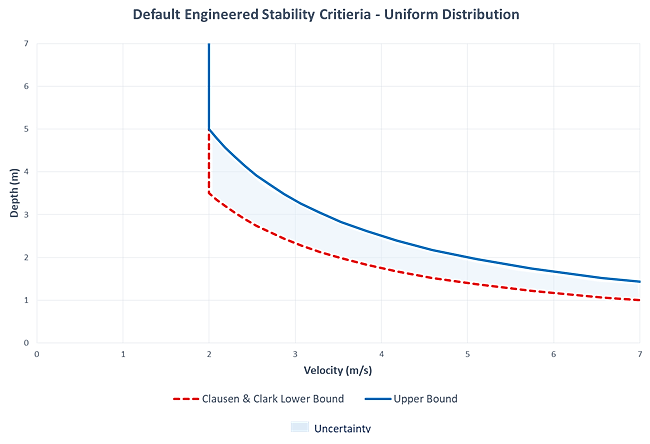
The only literature available for engineered construction structural stability is from USACE (1985) [?]; however, methods used to determine the USACE stability thresholds cannot be found. Since additional relevant studies could not be identified, a uniform distribution between the Clausen and Clark most likely threshold and an upper bound of 10 meters squared per second (m2/s) is used. The most likely Clausen and Clark threshold is used as a lower bound because it is assumed that a low quality or deteriorating reinforced concrete or engineered structure could have a lower stability threshold than a good quality concrete structure. The upper bound was chosen because it is assumed that quality engineered structures will have a significantly higher stability threshold than any of the other construction types.
The default stability criteria for engineered construction is shown in Figure.
Wood-Anchored
Becker et al. (2011) [?] built a theoretical model to determine the response of typical Canadian wood-frame homes to an array of 2,500 flood condition combinations. They evaluated 3 failure mechanisms including fill, collapse, and float both individually and in combination. Each failure mechanism was evaluated by analyzing the load conditions at the structure and the resistance conditions of the structure. Structural resistance was determined using the dimensions of the structure along with the strength of individual building components, and each structure was assumed to be anchored. This model applicably "describes whether a typical wood-frame building will be safe for occupants or whether it will fail…"
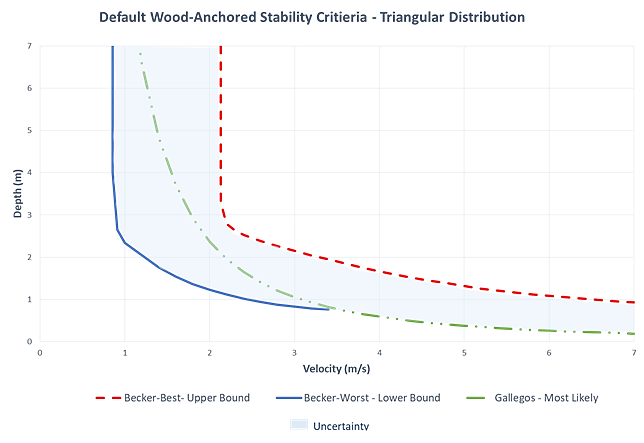
The study resulted in functions for two scenarios – the best and worst case building response. The worst case scenario is representative of structures with high external loads and low structural resistance whereas the best case scenario is representative of structures with low external loads and high structural resistance. Becker et al.'s best and worst case combination functions are used for the upper and lower uncertainty bounds for the default wood-anchored stability criteria. The horizontal drag force working against the structure is calculated as:
and the frictional force providing resistance is calculated as:
where
D = depth of water above the foundation.
ns = the number of stories.
hs = the height of the story.
pd = the hydrodynamic pressure.
L = the length of the home.
μ = the coefficient of friction.
W = the weight of the house.
FB = the buoyant force.
Gallegos et al. (2012) [?] looked at 3 levels of damage: inundation, structural failure, and washout. They analyzed 10 existing structural damage models coupled with a hydraulic flood model to determine which structural damage models were best at predicting structural failure and washout. Their work was based on the 1963 Baldwin Hills dam breach in Los Angeles, and while it's unclear if the homes in this area were buoyant or anchored, Gallegos et al. recognize that each model they analyzed implemented different building standards, modeling methods, etc. and propose their findings be used as a tool to characterize uncertainty.
Through calibration, they determined that 9.5 meters cubed per second squared (m3/s2) was the force threshold that maximized the predictive skill of determining washout and noted that their threshold is similar to other published thresholds such as McBean et al. (1988) [?] and USACE (1985) [?]. McBean et al. focused mainly on depth-damage functions but determined 9 m3/s2 as an appropriate general threshold for stability. It is unclear if the structures in their study were anchored or buoyant, and they also do not appear to differentiate between construction types. For those reasons, Gallegos et al.'s threshold was assumed to be more appropriate given the level of detail provided and was used as the most likely threshold for the wood-anchored stability criteria.
The Gallegos function and the Becker worst function meet and overlap when depths are below 1 meter and velocities are between 3 m/s and 4 m/s. For any depth and velocity sampled beyond where the two functions overlap, the Gallegos function will be implemented to essentially capture the lowest possible threshold.
The default stability criteria for wood-anchored construction is shown in Figure.
Manufactured
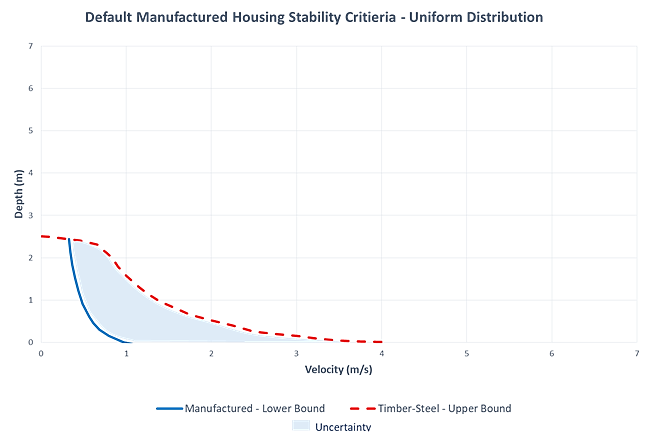
The Hazus tool implements manufactured stability criteria based on information provided by FEMA (1985). As stated in the manual, "it is assumed that drag forces exceed manufactured housing design capacity around 13 pounds per linear foot of home length and it is possible to determine the relationship between depth and velocity for this threshold level of drag force. This results in a simpler velocity-damage function for MH (manufactured housing) than for the other material types; for a given depth, if the velocity equals or exceeds the collapse velocity, the structure is assumed to collapse."
No other research was identified that proposes stability criteria for manufactured housing; however, FEMA provided a second edition of the aforementioned 1985 document in 2009 [?]. While the 2009 document does not provide updated stability criteria, it does suggest that structural resistance guidelines implemented by the U.S. Department of Housing and Urban Development (HUD) in 1994 have improved manufactured housing performance in wind and flood events since. As a result, it is assumed that the manufactured housing stability threshold would be higher post-1994 and more consistent with wood-buoyant homes.
To account for the uncertainty, the default manufactured housing criteria in LifeSim 2.0 and later is set to a uniform distribution between the Manufactured stability criteria provided in the Hazus manual and the timber-steel criteria provided by Dale et al. (2004) [?] for wood-buoyant structures. The timber-steel threshold provided by Dale is the lowest threshold for the other construction types in the sections to follow and represents the next threshold up from manufactured housing. It is used as the upper bound because while manufactured housing stability is assumed to have improved, it is unclear by how much.
Furthermore, it is assumed that manufactured housing will generally be built with lighter materials easier for transport than some of the heavier, site-built wood-buoyant homes. The manufactured housing and timber-steel thresholds cross when velocities are less than 1 meter and depths are between 2 and 3 meters. For any depth and velocity sampled beyond where the two functions overlap, the timber-steel threshold is implemented to essentially capture the lowest possible threshold.
The default stability criteria for manufactured construction is shown in Figure.
Masonry
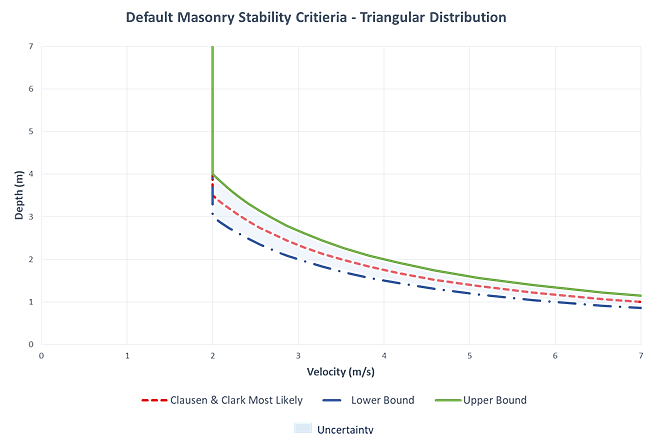
Clausen and Clark (1990) [?] provide the most comprehensive look at masonry stability with their study based on the Dale Dyke dam failure that took place in the UK in 1864. They present a stability threshold that was determined using calculated flood conditions and structural damage data collected and published by Samuel Harrison (1864) [?] post-flood. Clausen and Clark looked at 3 damage categories: inundation, partial damage, and total destruction. Based on their work, neither partial nor total damage of masonry structures can occur at velocities below 2 m/s, and total destruction occurs when the depth times velocity is greater than 7 meters squared per second (m2/s).
Clausen and Clark's threshold is applied directly in RESCDAM (RESCDAM, 2000) [?]. USACE also provides masonry stability criteria, but no justifying methodology can be found in the literature. Since additional methods are not presented, and Clausen and Clark's threshold for masonry structures is higher than the various thresholds presented for wood-framed structures, a lower and upper bound of uncertainty for a triangular distribution is assumed. For the lower bound, a threshold of 6 m2/s is used which is slightly lower than the Becker Best threshold, and for the upper bound, a threshold of 8 m2/s is used. It is assumed that with modern building standards and technologies it is unlikely that a masonry structure would have lower stability than a well-built wood structure unless it is an older building. However, it is likely that modern building practices have improved the stability threshold since the 1800s, so an upper bound was established to match this assumption.
The default stability criteria for masonry construction is shown in Figure.
Wood-Buoyant
Black (1975) [?] was the first to publish proposed methodology for determining the stability criteria for wood-buoyant structures. He considered buoyancy, hydrostatic pressure, and dynamic pressure to determine the external loads required to move a structure and provided the corresponding depth and velocity functions at which a structure would fail if exceeded. The buoyant, hydrostatic, and dynamic forces were combined into Equation to analyze the velocities that would lead to movement of the houses:
where
V = average water velocity (m/s).
f = the coefficient of friction.
Rb = the buoyancy ratio.
Wh = the total house weight (kg).
d = the submergence depth (m).
L = the length of exposure (m).
1.03 = the combined constant of the unit weight of water (kg/m3) and the acceleration of gravity (9.8 m/s2).
The standard house size used for Black's analysis was 7.3 meters wide by 9.75 meters long for a total of 71.18 square meters on the first floor. He assumed that when the buoyant force was equal to the weight of the structure that the structure would float and when the force exerted on the house was equal to the frictional force preventing movement then the structure would fail. His study was not empirically based but performed well in a later study by Gallegos et al. (2012) [?]. Black established functions for 1 story, 1.5 story, and 2 story homes evaluating each with drywall and plaster wall and then also evaluating the 1.5 story drywall with a brick veneer. The lightest structure he evaluated was the 1 story with drywall (7,121 kg) and the heaviest he evaluated was the 1.5 story with drywall and a brick veneer (25,442 kg).
Sangrey et al. (1975) [?] later expanded Black's research using a case study of 155 random structures from the Chemung River floodplain impacted by the 1972 flood from Tropical Storm Agnes. They collected data on collapsed homes from the flood using aerial photos and ground survey. Sangrey et al. changed the hydraulic coefficient used by Black from 1 to 2 and determined that the damage criteria proposed by Black were too conservative. As a result, they proposed new criteria based on a dimensionless force parameter and a corresponding normal force/buoyancy parameter.
Dale et al. (2004) [?] then used the work of Black and Sangrey et al. to adapt the Black functions to heavier and larger Australian construction. For example, the lightest structure in Dale et al.'s study was a timber clad, steel-roofed structure weighing nearly 19,000 kilograms. Dale et al. noted that Sangrey et al. changed the hydraulic coefficient from 1 to 2 because "Black applied the Bernoulli equation (incorrectly) in calculating a pressure rather than a drag force. The Bernoulli equation does not allow for a drag coefficient and the horizontal forces therefore differ by a factor of two." Dale et al. then moved forward with using a drag coefficient of 2 as well and evaluated 3 different types of structures: brick veneer walls, fiber cement cladding, and timber cladding.
The equation used for horizontal force on a structure due to flowing water is:
where
CD = the drag coefficient.
FH = the horizontal force.
ρ = the water density.
v = the velocity.
b = the width of the house.
d = the depth of water above the foundation.
While Dale et al.'s study was not empirically based, it also performed well later in Gallegos et al.'s study. Of the three studies, the functions provided by Dale et al. are the most representative of larger, modern construction for wood-buoyant structures. As such, Dale et al.'s functions are used for the wood-buoyant LifeSim 2.0 defaults. Two default settings are presented depending on the availability of data in the structure inventory to determine if a structure is light or heavy based on weight.
Whether a structure is light or heavy can be determined by looking at building composition. For instance, a home built with drywall will be lighter than a home built with plaster, and a home built with brick siding will be heavier than a home built with wood siding. Factors that can impact the weight of a home include, but are not limited to:
- Siding material
- Number of stories
- Roofing material
- Square footage
For reference, the lightest structure analyzed by Dale et al. used timber cladding and a steel roof and weighed around 19,000 kilograms at around 192.7 square meters. According to Dale et al., fiber cement cladding weighs around 3.3 times more per cubic meter than timber cladding, brick cladding weighs around 4.2 times more per cubic meter than timber cladding, and a tile roof weighs around 8.3 times more per square meter than a steel roof.
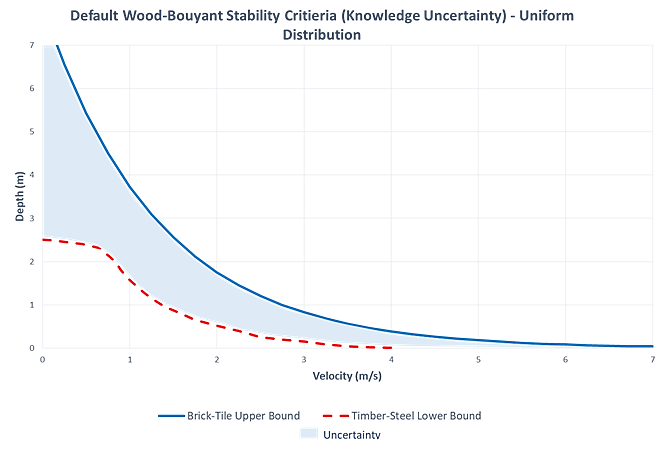
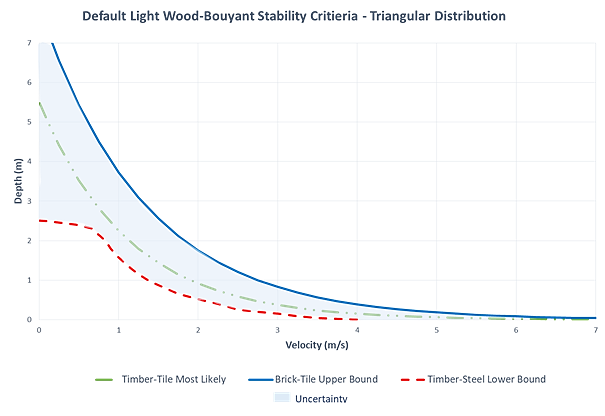
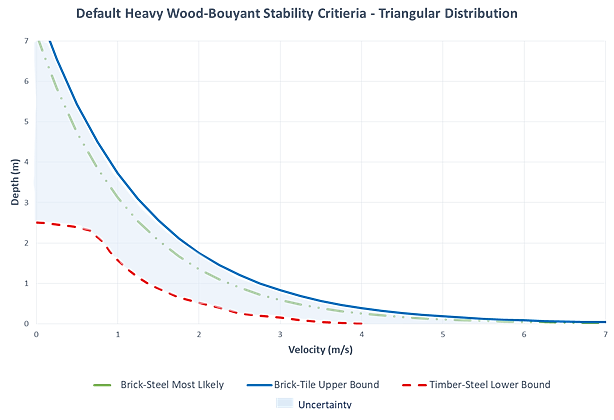
When data are available to indicate the weight of a structure, two default criteria with a triangular distribution are available – a light threshold and a heavy threshold. The uncertainty bounds for both most likely thresholds are the same. The Dale et al. lightest (timber – steel) function is the lower bound, and the heaviest (brick – tile) threshold is the upper bound.
These bounds allow for the full range of the four thresholds provided by Dale et al. to be sampled with more values tending toward the most likely function selected. For structures that would be considered light in weight, the Dale et al. timber – tile function is used as the most likely threshold. For structures that would be considered heavy in weight, the Dale et al. brick – steel function is used as the most likely threshold.
If there is insufficient data available to provide an indication if the structures are heavy or light, then the default stability criteria are a uniform distribution between Dale et al.'s lightest threshold (timber – steel) and heaviest threshold (brick – tile).
The default stability criteria for wood-buoyant construction is shown in Figure.
If data are available to provide an indication of the structure's weight, then the following criteria are used to determine which most likely function to select:
- If the weight of the structure is less than 33,623 kilograms (kg), then use the light threshold.
- If the weight of the structure is greater than or equal to 33,623 kilograms (kg), then use the heavy threshold.
These weight criteria are based on the estimated average weight between the timber-tile (light most likely structure) and brick-steel (heavy most likely structure). These weights were estimated using the floor plan and roofing and siding measurements and weights provided by Dale et al. An estimated weight was calculated for the siding and roofing of each structure type. Then using the provided weight of 19,000 kilograms for the lightest structure, the estimated roofing and siding weight for that structure type was subtracted to determine an estimated weight of all remaining building components that are not roofing or siding. The remaining weight was used as a constant for all structure types.
Table provides the estimated weight for each structure type.
| Siding | Roofing | |
|---|---|---|
| Steel | Tile | |
| Timber | 19,000 | 27,479 |
| Fiber | 19,393 | 27,872 |
| Brick | 39,768 | 48,246 |
Figure and Figure show the default stability criteria for light and heavy wood-buoyant construction, respectively.
USACE (1985) [?] proposed functions for wood framed structures, but due to a lack of justifying methodology, it is unclear if the functions are for wood-anchored or wood-buoyant structures. However, the USACE wood framed criteria are comparable to other attached structure criteria, and it is assumed that in Gallegos et al. (2012) [?], they represent attached structures.