Viewing LifeSim Results
When a simulation has been created for a LifeSim study, the simulation should be computed, and the results should be reviewed. During a simulation compute, summary results for each iteration are written out to a database. The user can then generate detailed iteration results to view agent-level simulation data such as animations and evacuation timing. Agent-level refers to viewing results down to the vehicle or evacuating group level. The detailed iteration results are computed per iteration to save both storage space and computation time. Results include summary tabulated results by iteration, summary box and whisker plots, plot by iteration, and plot by uncertainty. In addition, detailed output can be generated by iteration allowing the user to animate the simulation in the map window and view detailed iteration plot results.
Simulation Results Options
LifeSim Version 2.0 and later provides users with the ability to view summary results for all simulations or results for individual simulations.
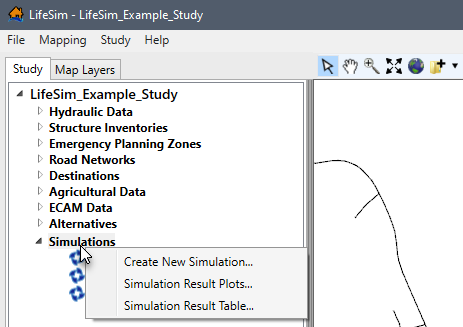
To view the simulation summary results for all simulations, from the LifeSim main window, from the Study tab, from the Study Tree, right-click Simulations. Click Simulation Result Plots or Simulation Result Table from the shortcut menu (Figure).
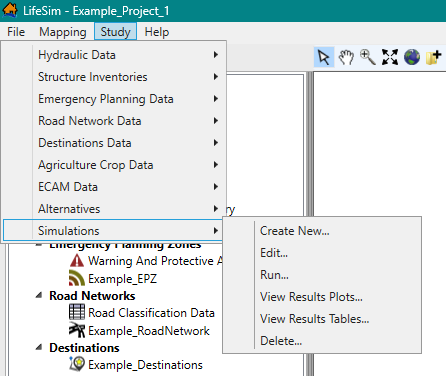
Alternatively, from the Study menu, point to Simulations, and click View Results Plot or View Results Table from the sub-menu (Figure). Section Open Summary Results provides an overview of the summary results for all simulations.
NOTE: All results plot windows contain the same general plotting tools (located on the right side of the plot window) used for customizing plots. Review Customizing Plots and Plotting Tools for instructions on using the general plotting tools.
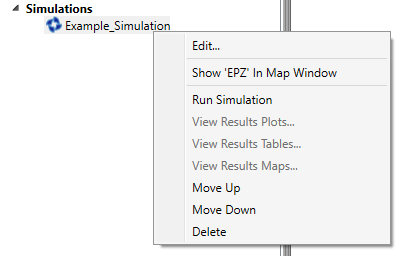
To view the simulation results for a specific simulation (e.g., Example_Simulation in Figure), from the LifeSim main window, from the Study tab, from the Study Tree, under Simulations, right-click on a simulation to view the shortcut menu commands (Figure). Sections View Simulation Results Plots, Simulation Results Table, and Simulation Results in Map Window provide details on viewing the simulation results in a plot, table, and in the map window, respectively.
Open Summary Results
Users can view the simulation summary results in a table or in a plot window.
Simulation Result Plots
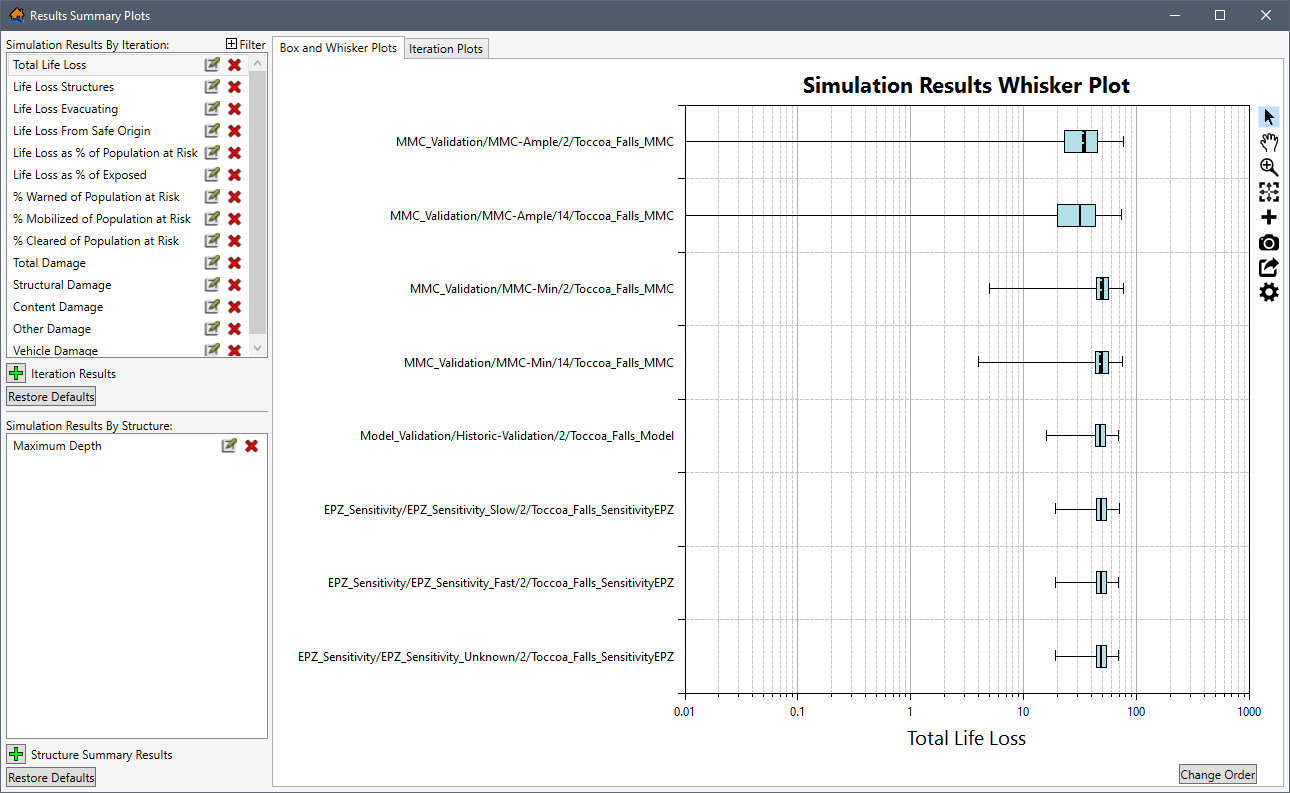
The Simulation Result Plots (Figure) command opens the Results Summary Plots dialog box (Figure).
The Results Summary Plots is divided into three main panels. The first panel located at the top left is the Simulation Results By Iteration panel. The second panel located at the bottom left is Simulation Results By Structure. The third panel located on the right-side is the plot window containing two tabs: Box and Whisker Plots and Iteration Plots.
However, there is a fourth optional panel: the Filter panel (Figure) is an expandable panel that is
opened by clicking
the Filter  expand
button from the Simulation Results By Iteration panel. To close the optional Filter panel,
click the Filter collapse
expand
button from the Simulation Results By Iteration panel. To close the optional Filter panel,
click the Filter collapse  button.
Simulation Results Plot Options
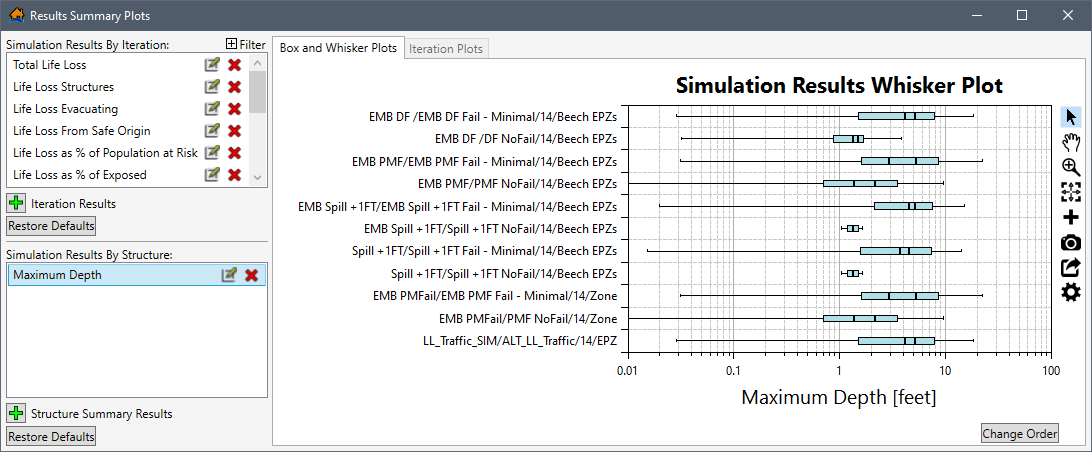
The Simulation Results By Iteration panel (Figure) lists all of the default predefined iteration results. Select a specific iteration simulation results series to set the results to display in the plot window.
NOTE: The Simulation Results By Iteration selection updates the data displayed in the Box and Whisker Plots and Iteration Plots tabs. However, the Simulation Results By Structure selection (e.g., Maximum Depth in Figure) only updates the Box and Whisker Plots. Notice the Iteration Plots tab disabled.
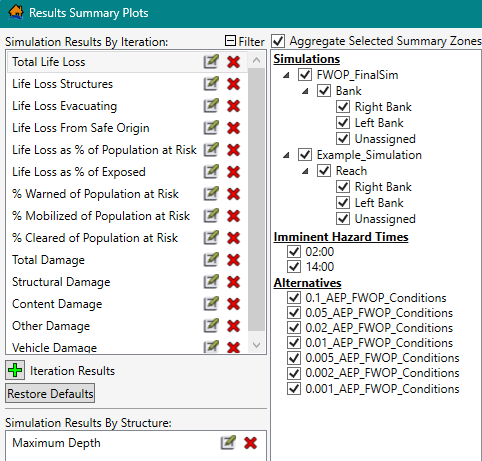
The expandable Filter panel (Figure) contains three
categories -- Simulations, Imminent Hazard Times, and Alternatives -- for limiting the
simulation results displayed in the plot window by aggregated summary zones. Remove simulations from the plot window by
unchecking  the checkbox for
the aggregated summary zone. For the example provided in Figure, the results of
the Simulations: EPZ_Sensitivity and Imminent Hazard Times: 14:00 have been removed from
results displayed in the plot window.
the checkbox for
the aggregated summary zone. For the example provided in Figure, the results of
the Simulations: EPZ_Sensitivity and Imminent Hazard Times: 14:00 have been removed from
results displayed in the plot window.
In the Simulations category of the Filter panel (Figure), the simulations contain aggregation summary zones. For the example provided in Figure, the EPZ and Structure Name are aggregation summary zones for the EPZ_Sensitivity_Analysis simulation. All fields in the summary zone (e.g., Toccoa_Falls and Unassigned in Figure) are listed to allow specific fields to be filtered from the plot window. The aggregation summary zones listed for a simulation depends on the summary polygons defined for a simulation from the Create New Simulation dialog box (review Create a Simulation for more information regarding the setup for a simulation).
Uncheck the checkbox to
turn off the Aggregate Selected Summary Zones (Figure) to display the
results for all fields in the summary zone individually by not grouping the simulation
results by summary zone.
Create New Simulation Results
New iteration or structure summary results can be created and defined by clicking the add
 Iteration
Results or
add Structure
Summary Results (Figure) buttons, respectively.
The Expression Dialog (Figure) opens.
Iteration
Results or
add Structure
Summary Results (Figure) buttons, respectively.
The Expression Dialog (Figure) opens.
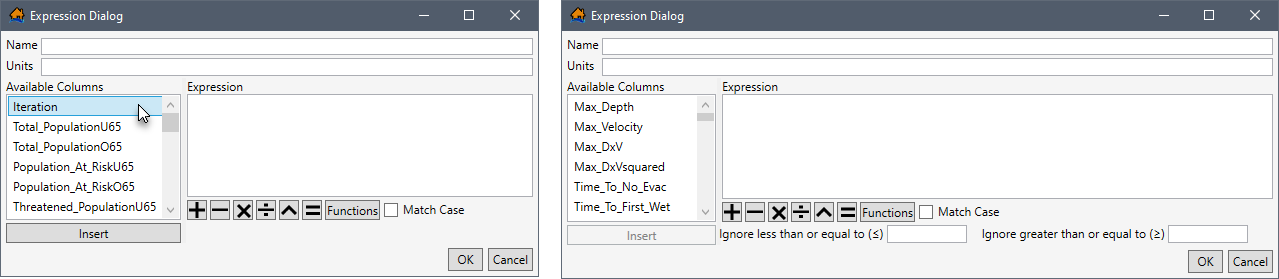
- In the Expression Dialog window (Figure), enter a name in the Name box. If desired, enter the units in the Units box.
- To build the expression for the results in the Expression box (Figure), select a specific result from the Available Columns list (e.g., Iteration in left of Figure). Double-click or select Insert.
- The Functions button (Figure) opens the Available Functions window providing a selection of all available functions in LifeSim (Figure). Select a function (e.g., AND in Figure) to view tips for using the function, and click Insert to add the selected function to the Expression box in the Expression Dialog (Figure).
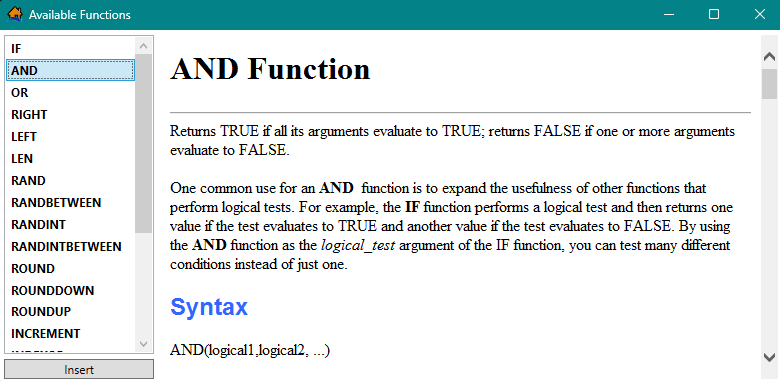
Figure: Available Functions Dialog Box - Turn on Match Case
 (Figure) by checking the checkbox to specify that the entered expression is case sensitive.
 - When creating a Structure Summary Results expression, enter a value in the Ignore less than or equal to (≤) (Figure) box to set a minimum limit for the results. Alternatively, enter a value in the Ignore greater than or equal to (≥) box to set a maximum limit for the results.
- Click OK to close the Expression Dialog (Figure) and create the new iteration or structure summary results series.
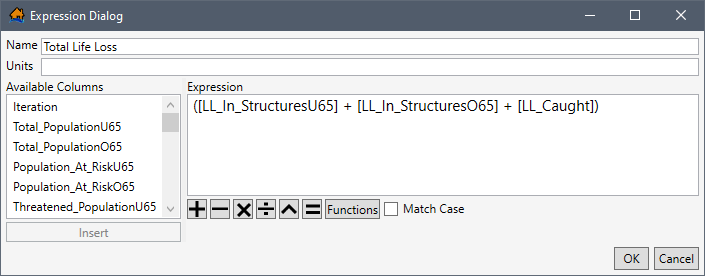
Edit Existing Simulation Results
Existing iteration or structure summary results can be created and defined by
clicking  for a
specific results series (e.g., Total
Life Loss in Figure). The Expression
Dialog opens for the selected results series (Figure). The Expression box contains
the default expression for the selected results series. Users can edit the default expression by following the same
steps described for creating a new simulation results series.
for a
specific results series (e.g., Total
Life Loss in Figure). The Expression
Dialog opens for the selected results series (Figure). The Expression box contains
the default expression for the selected results series. Users can edit the default expression by following the same
steps described for creating a new simulation results series.
Restore Default Simulation Results
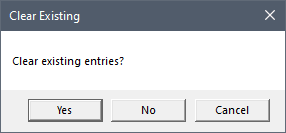
Edits made to existing default iteration results can be restored by clicking the Restore Defaults button located at the bottom left of the Results Summary Plots dialog box (Figure). A Clear Existing (Figure) message dialog box opens.
To clear all edits made to existing default iteration results, delete all created iteration results series, and restore deleted default iteration results, click Yes. Click No or Cancel to close the Clear Existing message dialog box without clearing edits made to existing default iteration results and without deleting newly created results.
Delete Existing Simulation Results
Existing iteration or structure summary results can be deleted by clicking
the Delete  button
for a specific results series (e.g., Total Life Loss in Figure).
button
for a specific results series (e.g., Total Life Loss in Figure).
NOTE: This cannot be undone for created summary results, but this action can be undone for deleted default summary results by clicking the Restore Defaults button.
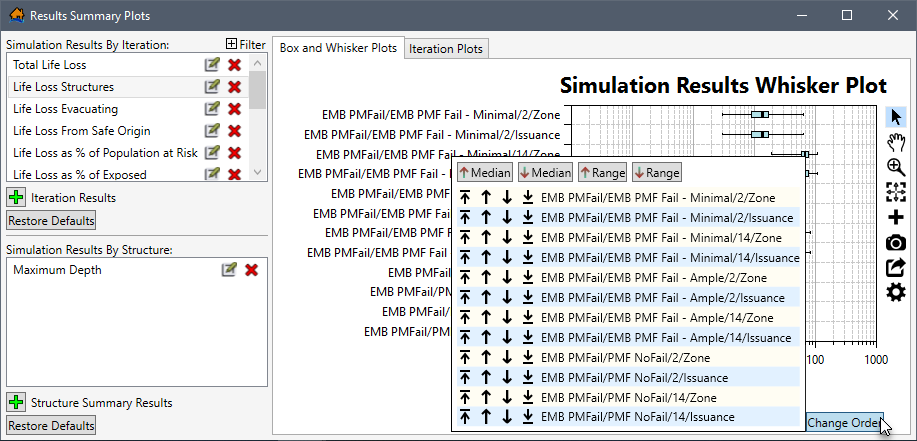
Box and Whisker Plots Tab
In addition to the Simulation Results By Iteration, Simulation Results By Structure, and Filter panels, the Box and Whisker Plots tab contains a Change Order button to further control how the results are displayed in the plot. Click the Change Order button to open a window that allows the user to set the order of the results in the plot window (Figure).
- Click
 to move the series to the top of the plot.
 - Click
 to move the series up one level.
 - Click
 to move the series down one level.
 - Click
 to move the series to the bottom of the plot.
Additionally,
- The
 button orders all series based on the median
value from low to high.
button orders all series based on the median
value from low to high. - The
 button orders
all series based on the median value from high to low.
button orders
all series based on the median value from high to low. - The
 button order all series based on the range of
values from low to high.
button order all series based on the range of
values from low to high. - The
 button orders
all series based on the range of values from high to low.
button orders
all series based on the range of values from high to low.
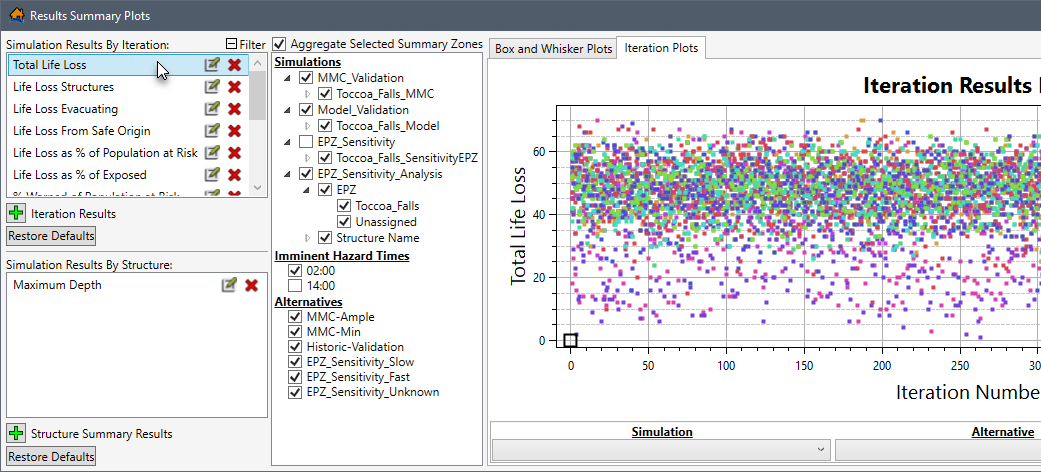
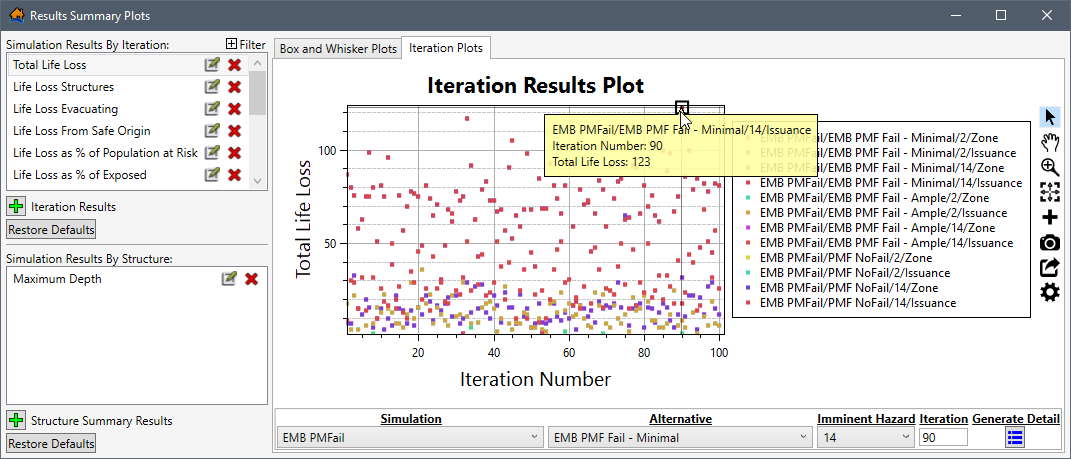
Iteration Plots Tab
In addition to the Simulation Results By Iteration, Simulation Results By Structure, and Filter panels panels, the Iteration Plots tab contains a panel at
the bottom of the plot window. The panel provides three dropdown list selections: Simulation, Alternative, Imminent Hazard; as well as
an Iteration box and
a Generate Detail  button (Figure).
The purpose of the panel is to allow users to set the simulation, alternative, and imminent
hazard to display in the plot. Then from the combined selection, users can visualize each iteration result in a scatterplot to help the user identify which iterations
calculated outlying values (e.g., Iteration Number: 90 in Figure). These outlying values, or any iteration of interest, can then
be selected to generate detailed output for that specific iteration by clicking
the Generate Detail button (Figure).
If detailed output is generated, LifeSim re-runs the specified iteration with the same random number sequence. But this time, much more information is saved. The detailed output generated contains information down to the evacuating group level regarding group size, location, and timing information during the simulation. The detailed output generated includes a database containing evacuation information for groups and their evacuation paths, structure inventory results shapefile, and a road network results shapefile. There is no limit to the number of iterations that LifeSim can generate a detailed output for. However, physical memory could become an issue at some point. Detailed outputs cannot be generated concurrently.
The Re-Generate Detailed Output
 option re-generates the specified
iteration's detailed output and is only available after a detailed output has been generated for a selected iteration. The Re-Generate
Detailed Output option is best used when the simulation has been altered and a detailed output had already been created for specific
iteration(s) and would need to be re-generated for the new simulation.
option re-generates the specified
iteration's detailed output and is only available after a detailed output has been generated for a selected iteration. The Re-Generate
Detailed Output option is best used when the simulation has been altered and a detailed output had already been created for specific
iteration(s) and would need to be re-generated for the new simulation.
Refer to View Detailed Output Results, Detailed Output Results, and View Result Map in the Map Window for more information on viewing the results of the generated detailed output for iterations.
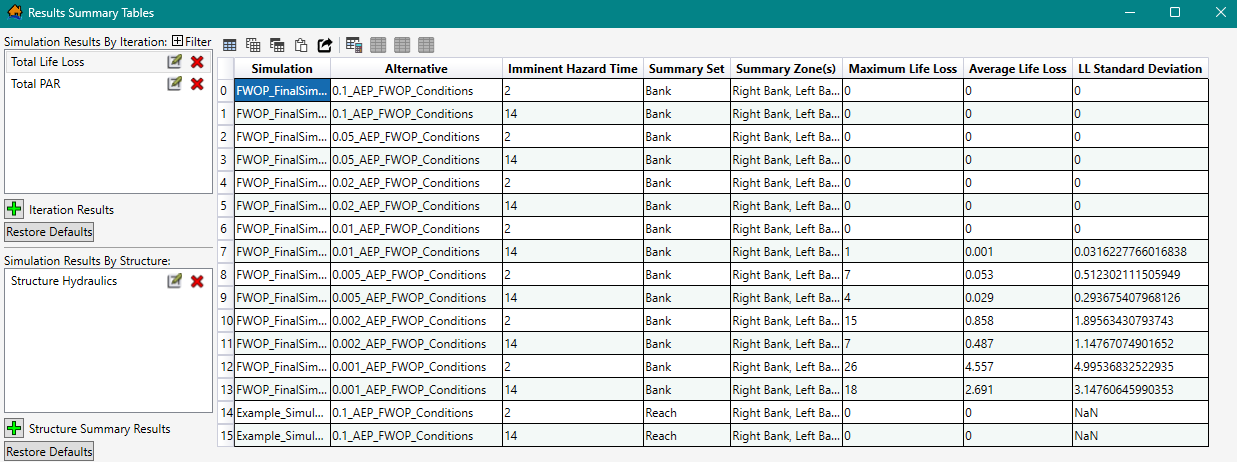
Simulation Result Table
The Simulation Result Table (Figure) shortcut menu command opens the Results Summary Tables (Figure). The Results Summary Tables is divided into three main panels. The first panel located at the top left is the Simulation Results By Iteration. The second panel located at the bottom left is the Simulation Results By Structure. And the third panel located on the right-side is the table containing the Export and Copy Tools and Selection Tools toolbars. Refer to Section Table Tools for more information regarding the table toolbars.
However, there is a fourth optional panel: the Filter panel (similar to Figure) is an expandable panel that is
opened by clicking
the Filter expand
button from the Simulation Results By Iteration panel. To close the optional Filter panel,
click the Filter collapse button.
Results Summary Tables Options
The expandable Filter panel (Figure) contains three
categories -- Simulations, Imminent Hazard Times, and Alternatives -- for limiting the
simulation results displayed in the plot window by aggregated summary zones. Remove simulation aggregation zones, imminent hazard times, and/or alternatives by
unchecking the checkbox for
the aggregated summary zone.
In the Simulations category (Figure), the simulations contain aggregation summary zones. For the example provided in Figure, the EPZ is the aggregation summary zone for the Indirect_AgDamages simulation. All fields in the summary zone (e.g., Decatur, Henderson and Unassigned) are listed to allow specific fields to be filtered from the table. The aggregation summary zones listed for a simulation depends on the summary polygons defined for a simulation from the Create New Simulation dialog box (review Create a Simulation for more information regarding the setup for a simulation).
Uncheck the checkbox
to turn off the Aggregate Selected Summary Zones (Figure) to display the results for all fields in the summary zone
individually by not grouping the simulation results by summary zone.
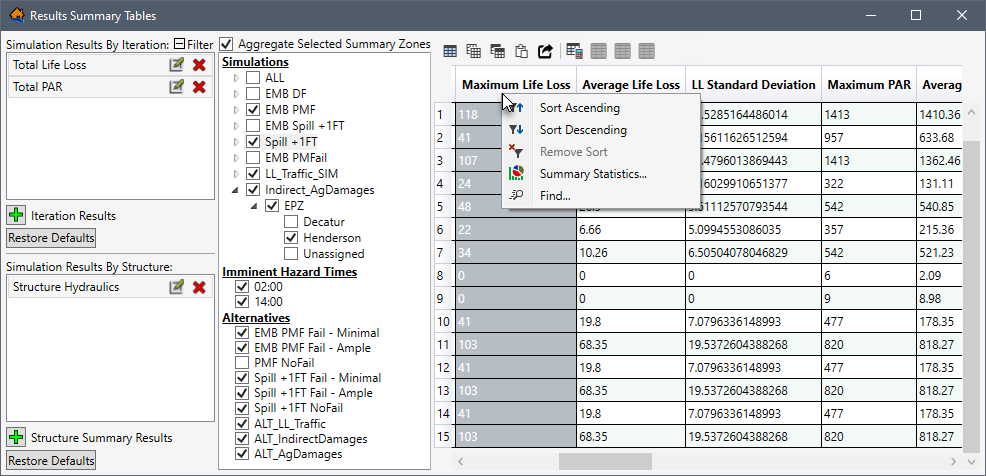
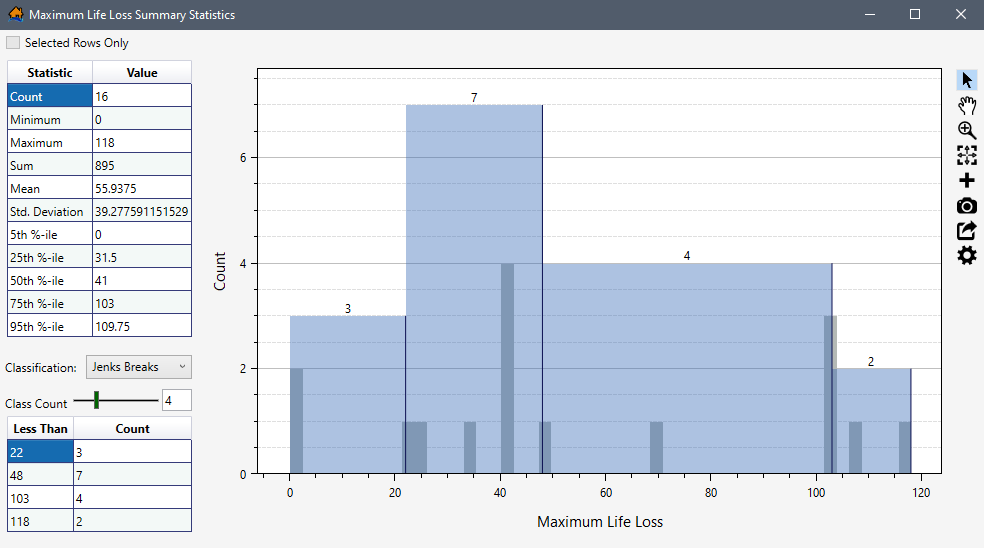
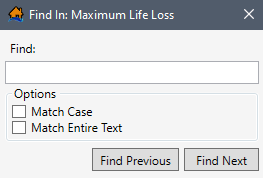
From the table, right-click a header row in the table to access the shortcut menu (Figure) for the column. The shortcut menu allows users to sort the table, remove table sorting, open the Summary Statistics dialog box for the column, or open the Find In dialog box for the column. Both respective dialog boxes are shown below.
- Summary Statistics
- Find In
As described in Simulation Result Plots, from the Simulation Results By
Iteration or Simulation Results By Structure panels (Figure), users can click
the button to create new simulation
results, click the edit button to
edit an existing simulation results, click the delete button
to delete a specific simulations results, and click the Restore Defaults button to restore all simulation results back
to defaults.
Create or Edit Simulation Results
From the Results Summary Tables dialog box (Figure), open an existing iteration or structure summary results by clicking
the Edit button. Alternatively, create a
new iteration or structure summary results by clicking the add Iteration
Results or add Structure
Summary Results buttons, respectively.
Either way, the Expression Dialog (Figure) opens.
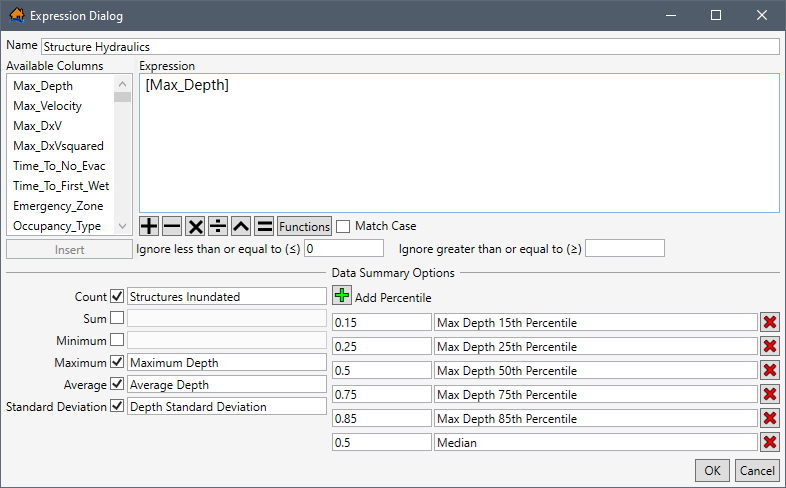
- In the Expression Dialog window (Figure), enter or edit the name of the simulation results in the Name box.
- To edit or build the expression for the results in the Expression box, select a specific results column from the list of Available Columns (e.g., Max_Depth in Figure), and click Insert.
- The Functions button opens the Available Functions window providing a selection of all available functions in LifeSim (same as Figure). Select a function (e.g., AND in Figure) to view tips for using the function, and click Insert to add the selected function to the Expression box in the Expression Dialog (Figure).
- Turn on Match Case by checking the checkbox to specify that the entered expression is case sensitive.
- Users can enter a value in the Ignore less than or equal to (≤) box to set a minimum limit for the results. Alternatively, enter a value in the Ignore greater than or equal to (≥) box to set a maximum limit for the results.
- Default Data Summary Options can be added to the summary results. Check the checkbox to include a default summary option (e.g., Count in Figure), and enter the column header text for the new column (e.g., Structures Inundated).
- Uncheck the default data summary option to remove the summary column from the table.
- Also, from the Data Summary Options panel (Figure), users can add summary percentile columns. Click the Add Percentile button to add a value box (e.g., 0.15 in Figure) and column header text box (e.g., Max Depth 15th Percentile in Figure). Enter the desired percentile and column header in the provided boxes.
- Click the Delete button to delete a specific percentile from the table.
- Click OK to close the Expression Dialog (Figure) and create the new (or update an existing) iteration or structure summary results series.
View Simulation Results Plots
The Simulation ‘Simulation Name’ Results Plot dialog box (Figure) provides a way to summarize the LifeSim iteration results for an alternative and compare them across different times of day. The results are summarized in the form of box and whisker plots to allow the user to quickly gain an understanding of the distribution of various results from the Monte Carlo simulation.
To open the simulation result plots for a simulation, from the LifeSim main window, from the Study tab, from the Study Tree, under Simulations, right-click on a simulation (e.g., Example_Simulation in Figure). From the shortcut menu, click View Results Plots. The Simulation ‘All’ Results Plot dialog box (Figure) opens for the alternatives associated with the simulation.
Summarize Plot Results Options
The Simulation ‘Simulation Name’ Results Plot dialog box (Figure) contains five tabs.
Of the five tabs, the Box and Whisker – Time of Day (Time of Day Box and Whisker), Box and Whisker – Alternatives (Alternatives Box and Whisker), and the Iterations (Results by Iteration) tabs includes the same selector panel at the bottom of the plot window. The purpose of the panel is to allow users to set the summary polygon, zones, and data to display in the plot window, and the dropdown selection updates all three tabs.
Review Customizing Plots and Plotting Tools for instructions on using the general plotting tools (located on the right side of the plot window) and for customizing plots.
The function of each dropdown list option for summarizing the results in the plot window are:
- Summary Polygon
- Summary Zones
- Plot Summary Data By
for the zone(s) from the Summary Zones list (Figure) to view the results for one or more areas in the study. Alternatively, select All Layers (default) to view results for all zones in the summary polygon.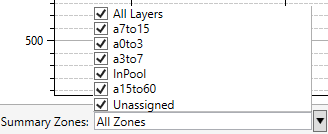
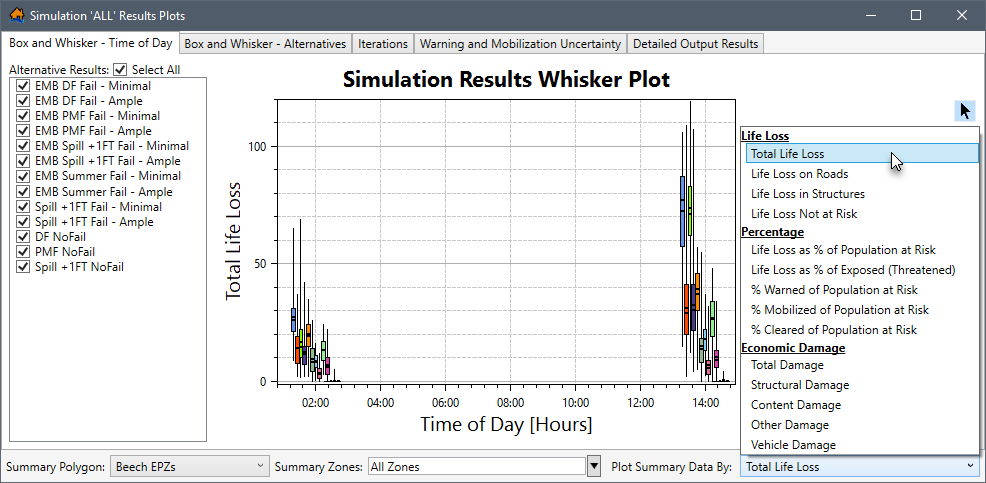
Time of Day Box and Whisker
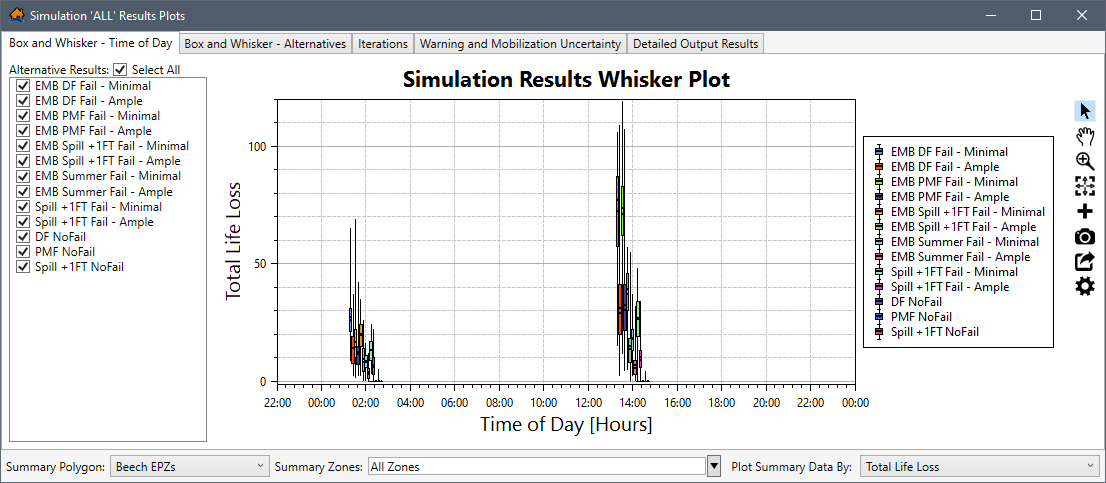
By default, the Simulation Results Plots dialog box (Figure) opens to the Box and
Whisker – Time of Day tab. The left side of the plot window provides
an Alternative Results panel containing a list of the alternative names
included in the simulation. To view the results for specific alternative(s) in the simulation, check the
checkbox(es) for the
desired alternative(s). By default, the Select
All checkbox is
checked (Figure) to display
all alternative results in the Simulation Results Whisker Plot.
In addition to the Alternative Results panel (Figure), the Box and Whisker – Time of Day tab contains a panel at the bottom of the plot window. The panel provides a Summary Polygon, Summary Zones, and Plot Summary Data By dropdown lists (review Summarize Plot Results Options). The purpose of the panel is to allow users to set the summary polygon, zones, and data to display in the Simulation Results Whisker Plot.
Alternatives Box and Whisker
From the Simulation Results Plots dialog box, select the Box and Whisker – Alternatives tab (Figure). The left side of the plot window provides the Alternatives and Imminent Hazard Time panels.
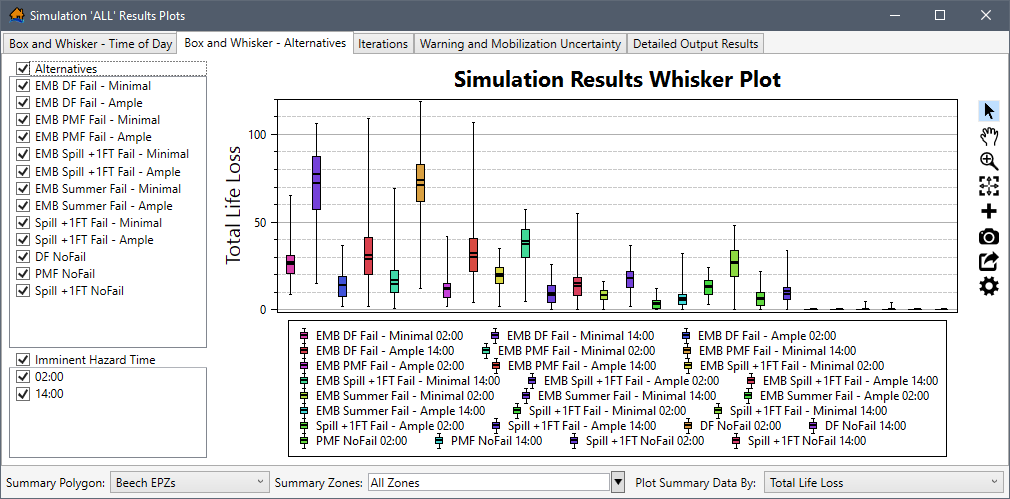
The Alternatives panel (Figure) contains a list of the alternative names included
in the simulation. To view the results for specific alternatives in the simulation, check the
checkboxes for the
desired alternatives. By default,
the Alternatives checkbox is
checked to display
all alternative results in the plot.
The Imminent Hazard Time panel (Figure) contains a list of all of the hazard occurrence
time(s) of day selected from the Create New Simulation dialog box for the
simulation (review Create a Simulation for more information regarding the setup
for a simulation). By default, the Imminent Hazard
Time checkbox is
checked to display
all time(s) of day in the plot.
In addition to the Alternatives and Imminent Hazard Time panels (Figure), the Box and Whisker – Alternatives tab contains a panel at the bottom of the plot window. The panel provides a Summary Polygon, Summary Zones, and Plot Summary Data By dropdown lists (review Summarize Plot Results Options). The purpose of the panel is to allow users to set the summary polygon, zones, and data to display in the plot.
Results by Iteration
From the Simulation Results Plots dialog box, select the Iterations tab (Figure). Viewing results by iteration allows the user to visualize each iteration result in a scatterplot to help the user identify which iterations calculated outlying values. These outlying values, or any iteration of interest, can then be selected to generate detailed output for that specific iteration.
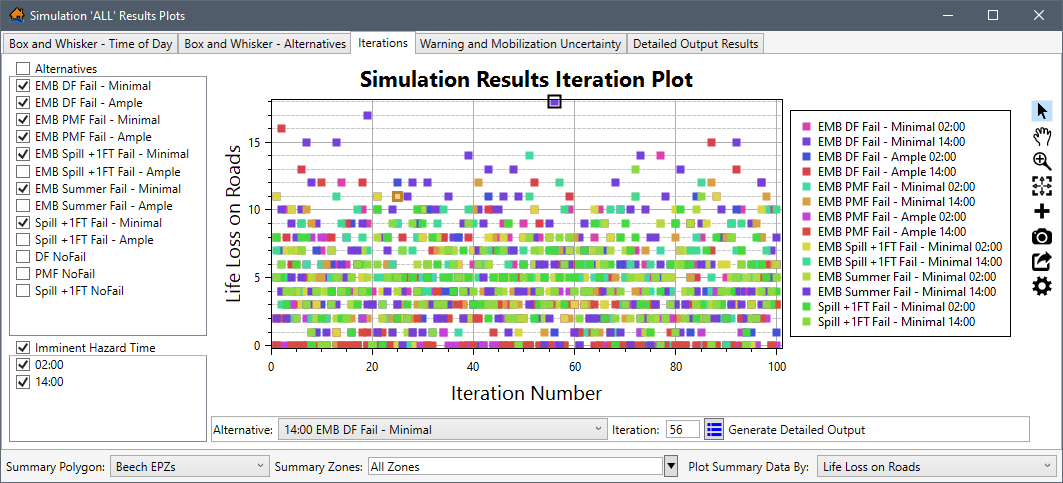
The left side of the plot window provides the Alternatives and Imminent Hazard
Time panels (Figure). The Alternatives panel contains
a list of the alternative names included in the simulation. To view the results for specific alternatives in the simulation,
check the checkboxes for
the desired alternatives. By default,
the Alternatives checkbox is
checked to display
all alternative results in the plot.
The Imminent Hazard Time panel (Figure) contains a list of all of the hazard occurrence
time(s) of day selected from the Create New Simulation dialog box for the
simulation (review Create a Simulation for more information regarding the setup
for a simulation). By default, the Imminent Hazard
Time checkbox is
checked to display
all time(s) of day in the plot.
In addition to the Alternatives and Imminent Hazard Time panels (Figure), the Iterations tab contains a panel at the bottom of the plot window. The panel provides a Summary Polygon, Summary Zones, and Plot Summary Data By dropdown lists (review Summarize Plot Results Options). The purpose of the panel is to allow users to set the summary polygon, zones, and data to display in the plot.
Detailed Output
Within the Simulation Results Iteration Plot (Figure), the Iterations tab
contains an Alternative dropdown list, an Iteration box, and a Generate Detailed
Output button.
The purpose of the detailed output panel is to allow users to identify iterations that calculated outlying
values (e.g., Iteration Number: 56 in Figure). These outlying values, or any iteration of
interest, can be selected to generate detailed output for that specific iteration by clicking the Generate Detailed
Output button (Figure).
If detailed output is generated, LifeSim re-runs the specified iteration with the same random number sequence. But this time, much more information is saved. The detailed output generated contains information down to the evacuating group level regarding group size, location, and timing information during the simulation. The detailed output generated includes a database containing evacuation information for groups and their evacuation paths, structure inventory results shapefile, and a road network results shapefile. There is no limit to the number of iterations that LifeSim can generate a detailed output for. However, physical memory could become an issue at some point. Detailed outputs cannot be generated concurrently.
The Re-Generate Detailed Output
option re-generates
the specified iteration's detailed output and is only available after a detailed output has been generated for a selected
iteration. The Re-Generate
Detailed Output option is best used when the simulation has been altered and a detailed output had already been created for specific
iteration(s) and would need to be re-generated for the new simulation.
Refer to View Detailed Output Results, Detailed Output Results, and View Result Map in the Map Window for more information on viewing the results of the generated detailed output for iterations.
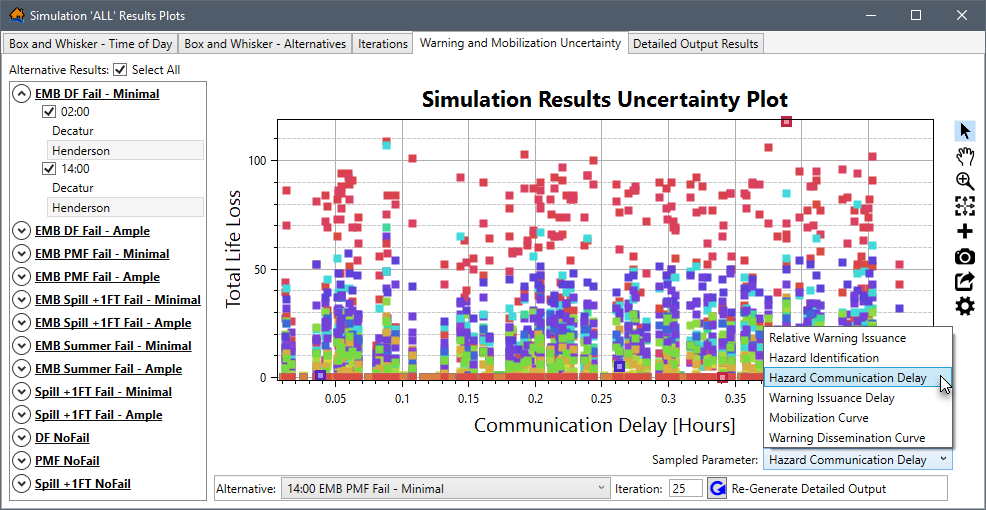
Warning and Mobilization Uncertainty
From the Simulation Results Plots dialog box, select the Warning and Mobilization Uncertainty tab (Figure). This tab allows the user to visualize the results of the sampled uncertainty to quickly identify parameters that are driving the consequences. For example, plotting by warning issuance could show a strong trend between when the warning is issued and the total life loss. These results can be extremely helpful in identifying alternatives for risk reduction measures.
The left side of the Warning and Mobilization Uncertainty tab (Figure) provides an
Alternative Results panel containing a list of the alternative names
included in the simulation. By default, the Select
All checkbox is checked
to display all alternative results in the plot. Each alternative listed in the Alternative Results panel contains
the time(s) of day and zones. To expand the alternative,
click  . To collapse the alternative,
click
. To collapse the alternative,
click  (Figure).
Include a time of day by checking the
checkbox (e.g., 02:00
and 14:00 are selected in Figure). Remove a time of day from the plot by
unchecking the
checkbox.
Include specific zones in the plot by selecting the zone name(s). For the example provided in Figure, for both 02:00 and 14:00, Henderson is selected, but Decatur is not selected; therefore, only the results from Henderson is displayed in the plot.
Sampled Parameter Options
Within the Simulation Results Uncertainty Plot (Figure), the Sampled Parameter dropdown list allows the user to summarize results by various parameters. Users can select different parameters for viewing data in the plot. By default, the Relative Warning Issuance option is selected and displayed in the plot. For the example provided in Figure, the Hazard Communication Delay option is selected and displayed in the plot.
For the Mobilization Curve and Warning Dissemination Curve options within the dropdown list, the X-axis represents the sample that was used to define the curve. A value of zero would mean the curve was sampled at the lower bound of the uncertaint, and a value of one would mean that the curve was sampled at the upper bound. For example, if the PAI curve maximum % initiated for an EPZ ranged between 85 and 95 percent and the X-axis value was zero, then the iteration had a maximum % initiated of 85 percent of the population for the EPZ.
Detailed Output
A panel located at the bottom of the Simulation Results Uncertainty Plot (Figure) contains an
Alternative dropdown list, an Iteration box, and a Generate Detailed
Output button.
The purpose of the detailed output panel is to allow users to identify iterations that calculated outlying
values (e.g., Iteration Number: 25 in Figure). These outlying values, or any iteration of
interest, can be selected to generate detailed output for that specific iteration by clicking the Generate Detailed
Output button (Figure).
If detailed output is generated, LifeSim re-runs the specified iteration with the same random number sequence. But this time, much more information is saved. The detailed output generated contains information down to the evacuating group level regarding group size, location, and timing information during the simulation. The detailed output generated includes a database containing evacuation information for groups and their evacuation paths, structure inventory results shapefile, and a road network results shapefile. There is no limit to the number of iterations that LifeSim can generate a detailed output for. However, physical memory could become an issue at some point. Detailed outputs cannot be generated concurrently.
The Re-Generate Detailed Output
option re-generates
the specified iteration's detailed output and is only available after a detailed output has
been generated for a selected iteration (as shown in Figure). The Re-Generate Detailed Output option is best used when the simulation
has been altered and
a detailed output had already been created for specific iteration(s) and would need to be re-generated for the new simulation.
Refer to View Detailed Output Results, Detailed Output Results, and View Result Map in the Map Window for more information on viewing the results of the generated detailed output for iterations.
View Detailed Output Results
When more information is desired for a specific iteration, detailed output can be generated. If detailed output is generated, LifeSim re-runs the specified iteration with the same random number sequence. But this time, much more information is saved. The detailed output generated contains information down to the evacuating group level regarding group size, location, and timing information during the simulation. The detailed output generated includes a database containing evacuation information for groups and their evacuation paths, structure inventory results shapefile, and a road network results shapefile. There is no limit to the number of iterations that LifeSim can generate a detailed output for. However, physical memory could become an issue at some point. Detailed outputs cannot be generated concurrently.
From the Simulation Results Plots dialog box, select the Detailed Output Results tab (Figure). This tab allows the user to visualize the detailed output results generated for specific iterations of interest. The left side of the Detailed Output Results tab provides a Detailed Evacuation Results panel containing a list of all iterations with detailed output results. The iterations are grouped by alternative name and time of day.
To view the results for an iteration, from the Detailed Evacuation Results panel, select the desired iteration (e.g., Iteration : ‘97’ – 02:00 Hazard selected in Figure). The Time Evacuating Histogram (shown in Figure), Cumulative Evacuation Outflow, and Cumulative Destination Arrivals tabs display the results for the selected iteration.
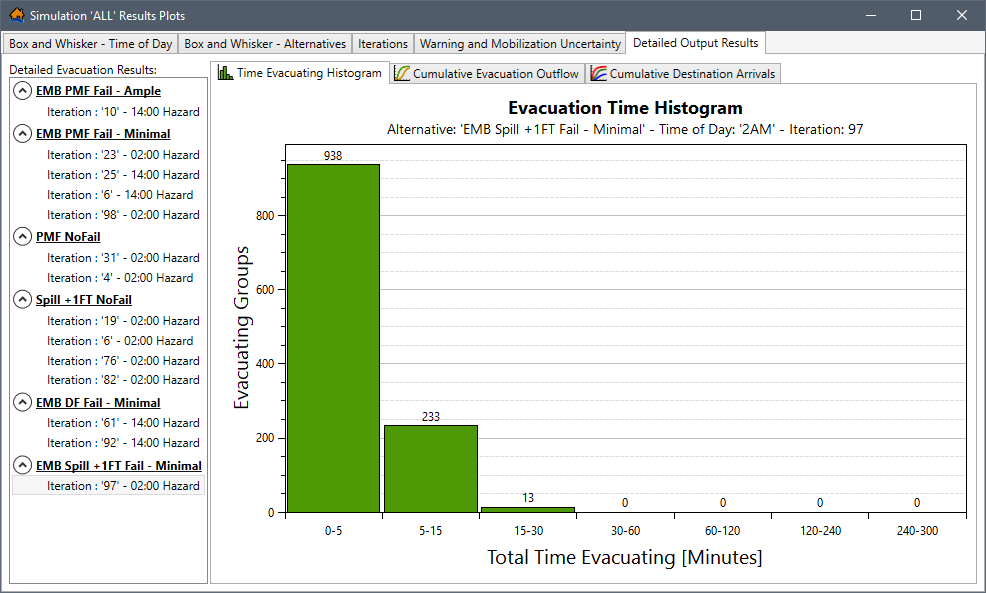
Time Evacuating Histogram Tab
By default, the Detailed Output Results tab opens to the Time Evacuating Histogram (Figure) tab. The time evacuating histogram, for the results of the iteration selected (e.g., Iteration : ‘97’ – 02:00 Hazard selected in Figure), gives the user an indication for how long it takes groups to evacuate to a destination. This data is gathered from the detailed output table (review Detailed Output Results) as the difference between TimeEnded and TimeMobilized.
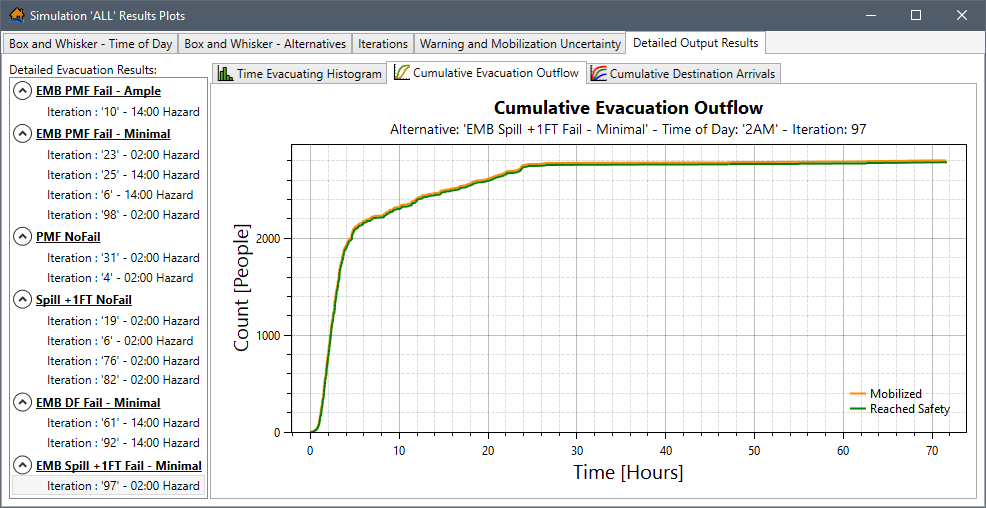
Cumulative Evacuation Outflow Tab
From the Detailed Output Results tab, select the Cumulative Evacuation Outflow tab (Figure). The evacuation outflow plot displays the cumulative flow of people that mobilize and reach safety over time. The plot can act as a good indicator of traffic congestion occurring during the evacuation. If the "Reached Safety" curve deviates from the "Mobilized" curve, this is an indication that traffic congestion is occurring.
Cumulative Destination Arrivals Tab
From the Detailed Output Results tab, select the Cumulative Destination Arrivals tab (Figure). The cumulative destination outflow plot shows cumulative curves for the arrival of vehicles to each destination in the study.
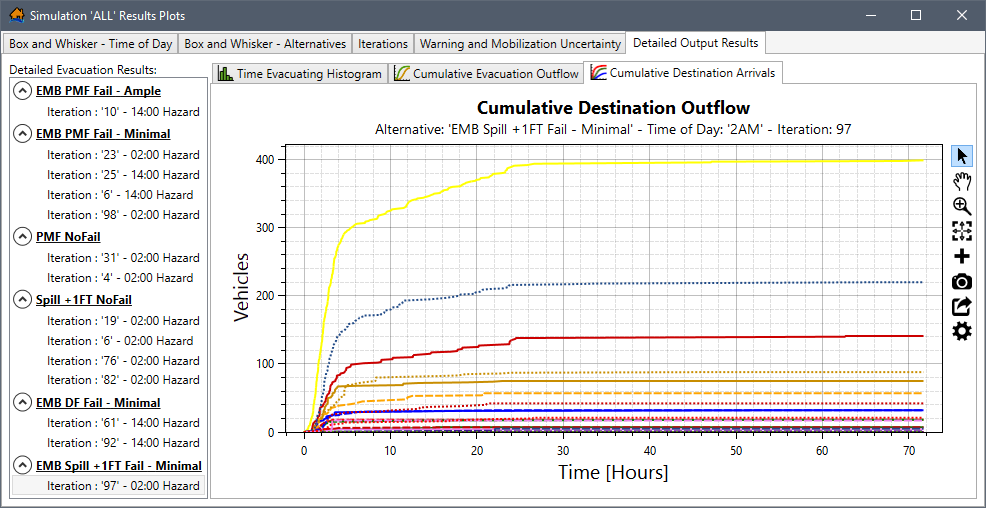
The plot can be very useful in checking the validity of the traffic simulation results. If a destination is showing significantly more outflow than historical department of transportation data would indicate, then the user should question the validity of the results and consider adjustments. If a destination that should be getting significant through-traffic is getting none, then the user should check the road network to make sure the roads are connected correctly (refer to Appendix C for tips on how to refine road network connectivity). Another way to check would be to animate the evacuation process to see the area of concern.
Simulation Results Table
To open the simulation results table for a simulation, from the LifeSim main window, from the Study tab, from the Study Tree, under Simulations, right-click on a simulation (e.g., Example_Simulation in Figure). From the shortcut menu, click View Results Tables. The Simulation Results Tables opens for the alternatives associated with the simulation (Figure).
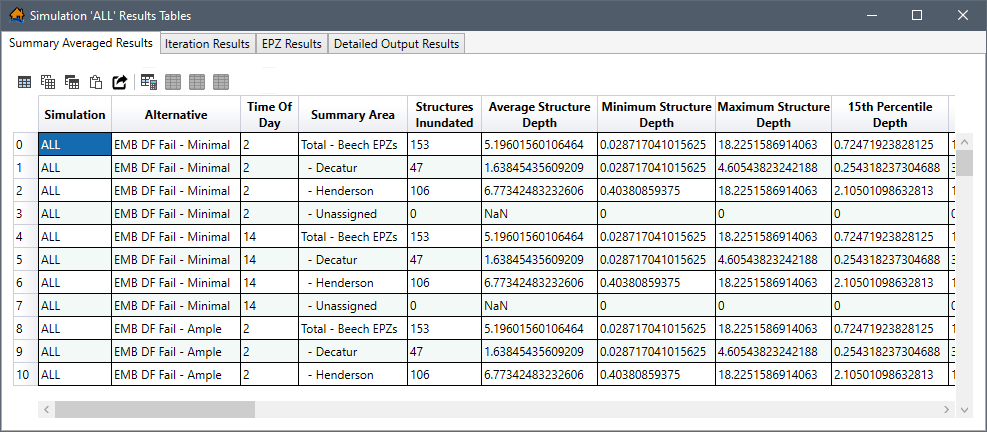
By default, the Simulation Results Tables opens to the Summary Averaged Results tab (Figure); however, the simulation results tables also contains an Iteration Results, EPZ Results, and Detailed Output Results tabs. The Export and Copy Tools and Selection Tools toolbars are located above the tabulated results in all four tabs. Refer to Section Table Tools for more information regarding the table toolbars.
From the table, the user can right-click a header row in the table to access the shortcut menu (similar to Figure) for the column. The shortcut menu allows users to sort the table, remove table sorting, open the Summary Statistics dialog box for the column, or open the Find In dialog box for the column. Refer to Section Results Summary Tables Options for more information regarding the Summary Statistics and Find In dialog boxes.
Summary Averaged Results
By default, the Simulation Results Tables opens to the Summary Averaged Results tab (Figure). The results
in the Summary Averaged Results tab can be summarized by alternative, time of day, and the summary area
by using the Select Rows By
Attribute  tool to
define equations to select results.
tool to
define equations to select results.
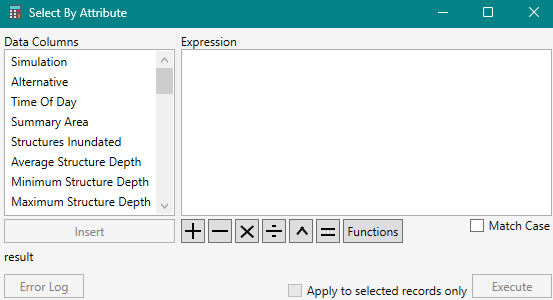
Click , and the Select By
Attribute dialog box opens (Figure). The Data Columns box provides a list of all the result
fields the user can select. The Functions button opens
the Available Functions window (Figure), which provides the scripting commands and functions for inputting into
the Expression box (Figure) the user can use to filter results.
Iteration Results
From the Simulation Results Tables, select the Iteration Results tab (Figure).
The left side of the tab provides an Alternative Results panel containing a list of the alternative names included in the simulation. Each alternative listed in the Alternative Results panel contains the time(s) of day included in the simulation. Click a specific time of day (e.g., 02:00 in Figure) for a specific alternative (e.g., EMB DF Fail – Minimal in Figure) to view the tabulated results.
To expand an alternative,
click . To collapse an alternative,
click .
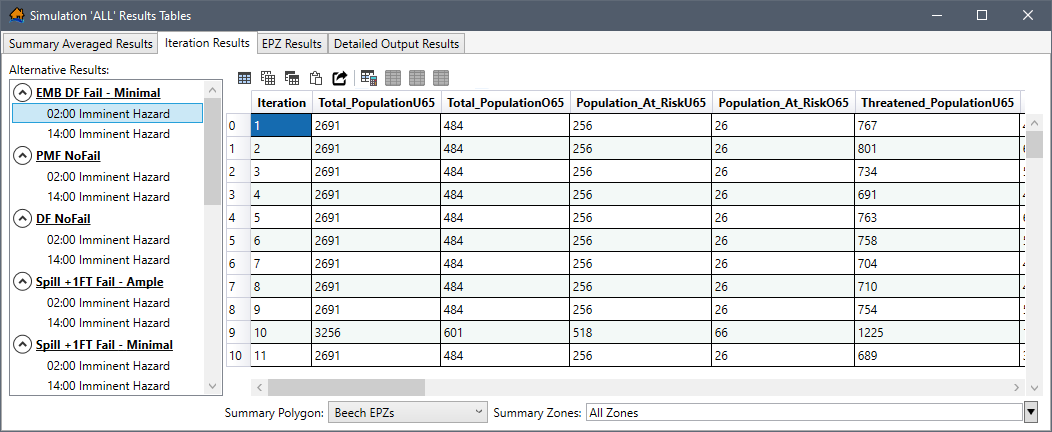
The panel at the bottom of the Iteration Results tab provides the Summary Polygon and Summary Zones dropdown lists for summarizing the results in the table.
The function of each is as follows:
- Summary Polygon
- Summary Zones
for the zone(s) from the Summary Zones list (Figure) to view the results for one or more areas in the study. Alternatively, select All Layers (default) to view results for all zones in the summary polygon..png)
EPZ Results
From the Simulation Results Tables, select the EPZ Results tab (Figure).
The left side of the tab provides an Alternative Results panel containing a list of the alternative names included in the simulation. Each alternative listed in the Alternative Results panel contains the time(s) of day included in the simulation. Click a specific time of day (e.g., 02:00 in Figure) for a specific alternative (e.g., EMB Spill + 1FT Fail – Minimal in Figure) to view the tabulated results.
To expand an alternative,
click . To collapse an alternative,
click .
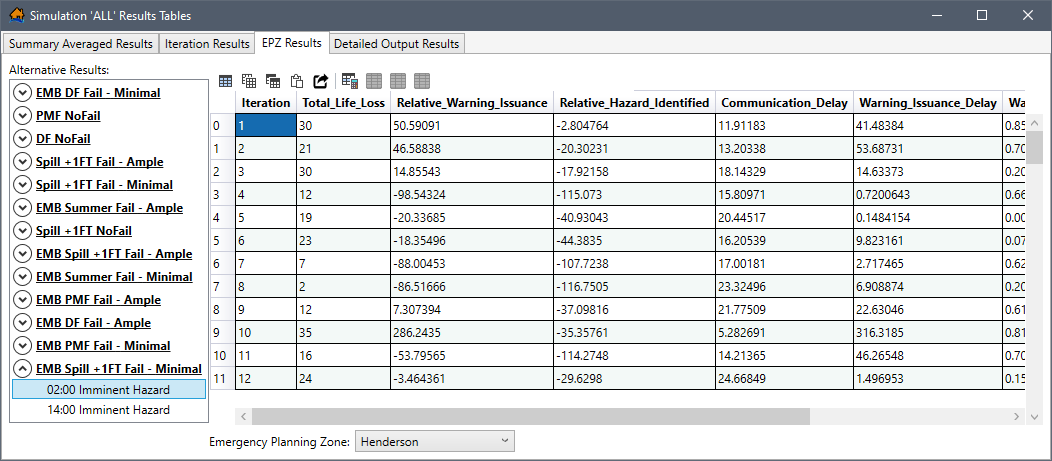
The panel at the bottom of the EPZ Results tab contains an Emergency Planning Zone dropdown list (Figure). The list allows the user to view the results one emergency planning zone (EPZ) at a time (e.g., viewing results for EPZ Henderson in Figure).
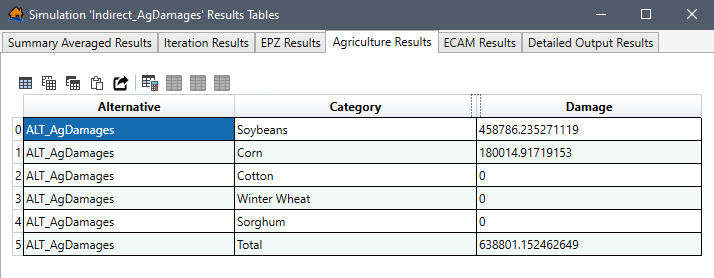
Agriculture Results
From the Simulation Results Tables, select the Agriculture Results tab (Figure). The agriculture damages are provided by alternative and crop category.
NOTE: The Agriculture Results tab is only available for simulations which include at least one alternative with an agriculture dataset and the agriculture compute option turned on at the alternative level (review Compute Options for an Alternative).
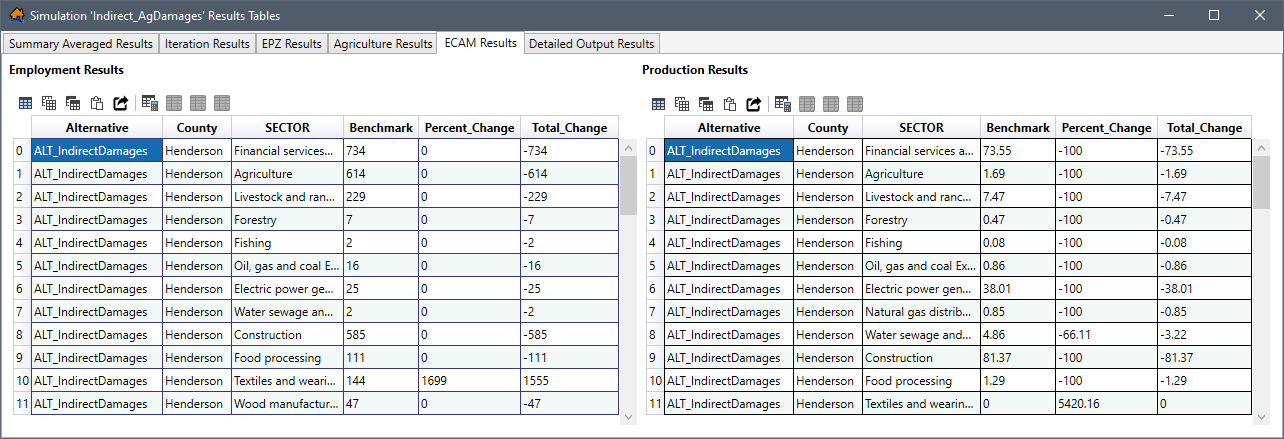
ECAM Results
From the Simulation Results Tables, select the ECAM Results tab (Figure). The ECAM results are provided in two tables: the Employment Results and the Production Results tables by alternative, county and ECAM sector.
NOTE: The ECAM Results tab is only available for simulations which include at least one alternative with an ECAM dataset (review Compute Options for an Alternative).
Detailed Output Results
From the Simulation Results Tables, select the Detailed Output Results tab (Figure).
This tab allows the user to visualize the detailed output results generated for specific iterations of interest. The left side of the Detailed Output Results tab provides a Detailed Evacuation Group Results panel containing a list of all iterations with detailed output results (Figure). The iterations are grouped by alternative name and time of day.
To expand an alternative,
click . To collapse an alternative,
click .
To view the results for an iteration, from the Detailed Evacuation Group Results panel, select the desired iteration (e.g., Iteration : ‘97’ – 02:00 Hazard in Figure).
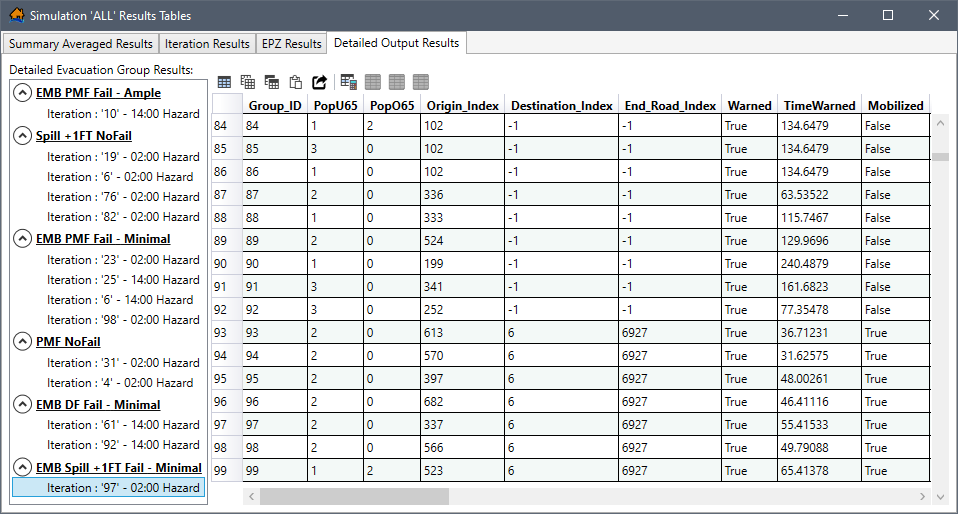
The functionality of the table is the same as the Summary Averaged Results table (refer to Simulation Results Table). The detailed output table contains information about each evacuating group’s behaviors during the iteration such as their origin, when they received the warning, when they mobilized, and where they evacuated to. This table can be very useful for finding specific information (e.g., the number of groups or people that did not get warned prior to getting trapped in their structure). The timing values for warning, mobilized, and ended are all relative to the imminent hazard time.
For every group that was defined for the iteration, the detailed output table (Figure) contains the number of people, their origin (coincides with row number in structure attribute table), their destination (-1 means no destination was reached), warning information, mobilization information, and if they were caught evacuating.
Simulation Results in Map Window
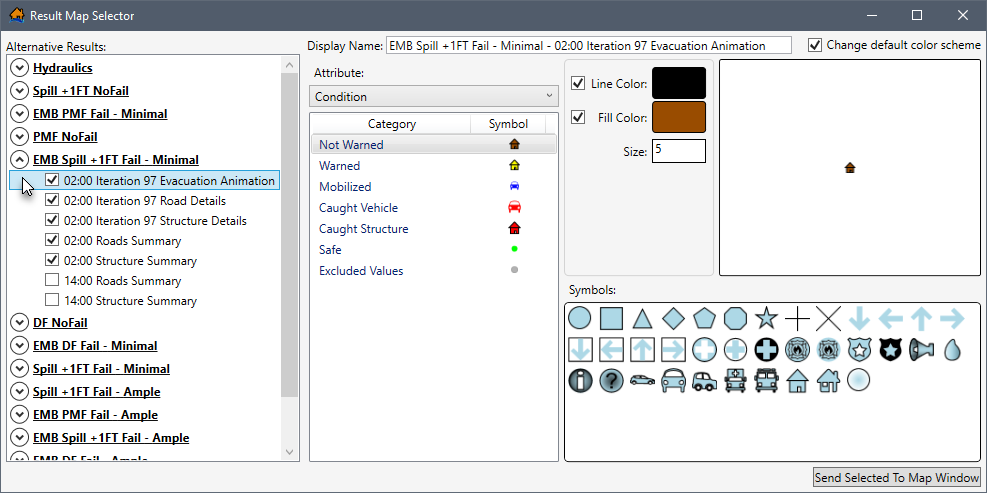
To open the simulation results maps for a simulation, from the LifeSim main window, from the Study tab, from the Study Tree, under Simulations, right-click on a simulation (e.g., Example_Simulation in Figure). From the shortcut menu, click View Results Maps. The Result Map Selector dialog box (Figure) opens for the alternatives associated with the simulation.
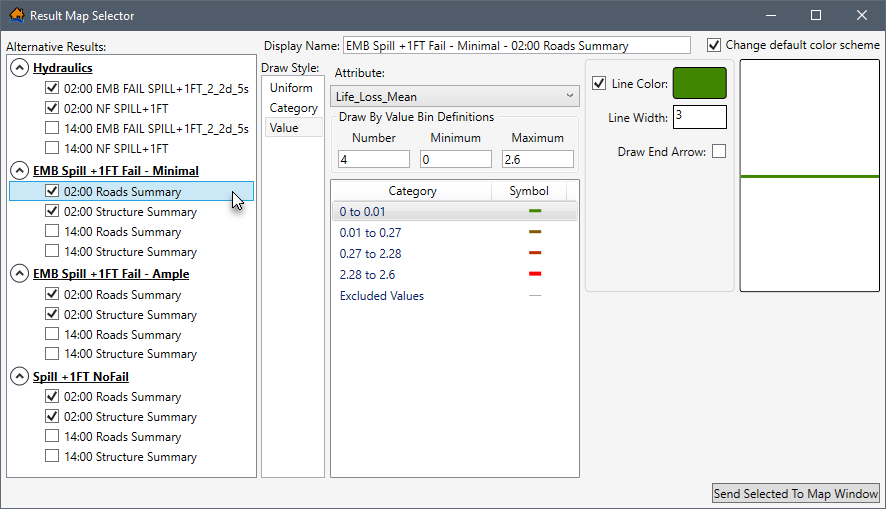
The left side of the Result Map Selector dialog box (Figure) provides an Alternative Results panel containing a list of the alternative names included in the simulation. Each alternative listed in the Alternative Results panel contains the time(s) of day and results source (e.g., hydraulic data, roads summary, structure summary).
To expand an alternative,
click . To collapse an alternative,
click .
To display alternative results selections to the map window, check the
checkbox next to the desired items.
Uncheck the
checkbox for an alternative result to exclude the results. Selected results are added to the map window when the Send Selected To Map
Window button (Figure) is clicked.
The panel on the right side of the Result Map Selector dialog box displays the default color scheme defined
for the selected alternative results. Users can modify the default color scheme by clicking the Change default color
scheme checkbox . For more information regarding
modifying the color scheme and drawing style, review Feature Draw
Properties Tab.
NOTE: The roads and/or structure summary data is only included in the Alternative Results panel (Figure) if the simulation was set to Generate Structure Summary Results and/or Generate Road Summary Results from the Create New Simulation dialog box for the simulation (review Simulation – Computation Engine Options for more information regarding the setup for a simulation). Furthermore, when detailed output results are generated for iterations, then the detailed output results (evacuation animation, road details and structure details) display in the Alternative Results panel (e.g., Iteration 97 in Figure). Iterations are grouped by alternative name and time of day.
Color Scheme Options
The Result Map Selector dialog box provides a default color scheme for the alternative results source (e.g., hydraulic data, roads summary, structure summary) listed in the Alternative Results panel. For the example provided in Figure, the hydraulic depth grid default color scheme is a continuous color ramp ranging from light blue to deep blue to identify hydraulic depths from shallow to deep.
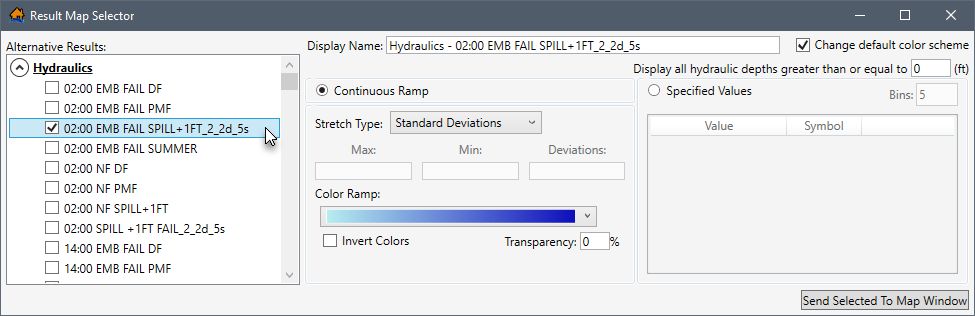
To modify the default color scheme for a specific alternative result:
- From the Alternative Results panel, select the desired results (e.g., Hydraulics 02:00 EMB FAIL SPILL + 1FT_2_2d_5s in Figure).
- Check the Change default color scheme checkbox.
- The feature draw properties can now be modified for any result selected from the Alternative Results panel. For more information regarding modifying the color scheme and drawing style, review Feature Draw Properties Tab.
View Result Map in the Map Window
To view any of the alternative results in the map window, from the Alternative Results panel (Figure), check
the checkbox for the results
of interest (e.g., Hydraulics 02:00 EMB FAIL SPILL +
1FT_2_2d_5s in Figure), and click Send Selected To Map Window. The Result Map
Selector dialog box closes, and the selected alternative results are added to the Map Layers tab and display
in the map window (Figure)
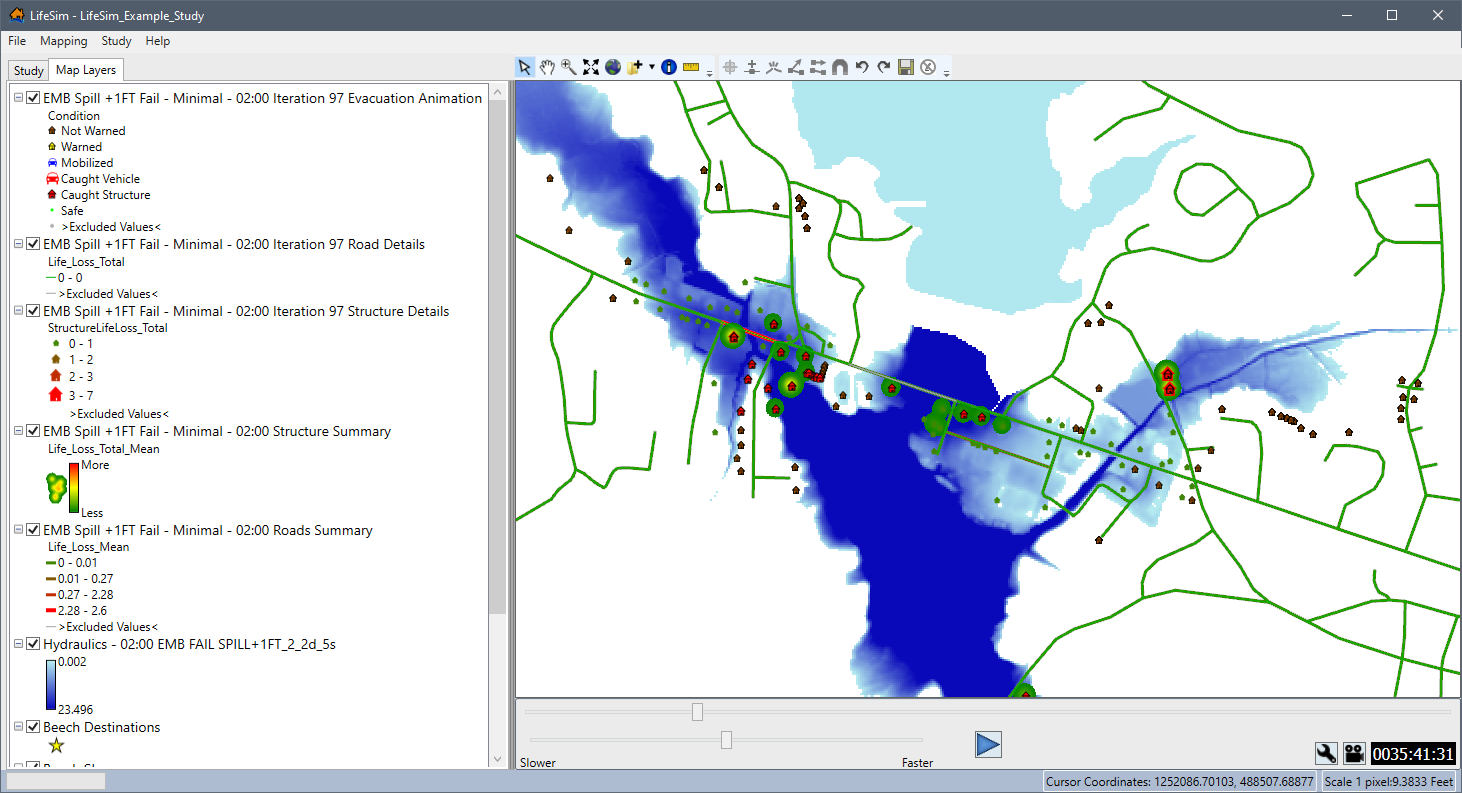
Road and Structure Details
The road and structure summary or detailed output can be viewed for an iteration (e.g., Iteration 97 Road Details in Figure) or an alternative (e.g., EMB Spill + 1FT Fail – Minimal - 02:00 Structure Summary in Figure) from the map window. The road and structure information added to the map window for the detailed output displays life loss total (i.e., Life_Loss_Total) that occurred inside each structure or on each road segment and is color-coded and changes by size. For example, an increasing loss of life in a structure, there is an increasing icon size and gray to red coloration. This output can be very useful for viewing the entire study area and highlight areas with the greatest risk for life loss in structures or on roads which require supplementary investigation.
Animate Alternative Results
Hydraulic results and detailed output results for iterations can be reviewed as an animation in the map window. The detailed output animation provides a dynamic view for the results of the iteration number selected (e.g., Iteration 97 in Figure). The animation results can be used to review evacuation routes, warning issuance times, hydraulic data, and other simulation items. The animations can also be exported as video files to share. The map window displays an animation playback control in the animation toolbar, which functions similarly to video controls for viewing the animation results in the map window (Figure).
The animation toolbar controls the evacuation animation and the hydraulic animation.
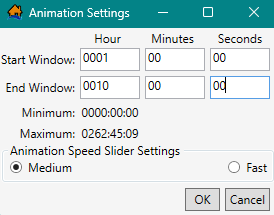
To edit the animation speed, or animation window start and stop
time, from the Animation Toolbar, click  . The Animation
Settings dialog box will open (Figure). From the Animation Settings dialog box, set the animation window start time and end
time and the slider settings. Click OK to apply the animation settings to the animation
playback. For the example in Figure, the user will now only be able to toggle (Figure) between
start time 0001:00:00 and 0010:00:00.
. The Animation
Settings dialog box will open (Figure). From the Animation Settings dialog box, set the animation window start time and end
time and the slider settings. Click OK to apply the animation settings to the animation
playback. For the example in Figure, the user will now only be able to toggle (Figure) between
start time 0001:00:00 and 0010:00:00.
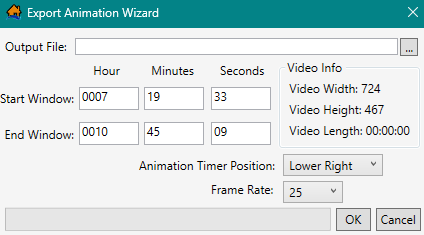
To export the animations as a video file to share,
click  from the Animation
Toolbar (Figure). The Export Animation Wizard dialog box (Figure) will open. From the Export Animation Wizard dialog box, identify
the Output File location and file name, the start and end animation window, and the timer position and frame rate for the exported
file. Click OK to create the video.
from the Animation
Toolbar (Figure). The Export Animation Wizard dialog box (Figure) will open. From the Export Animation Wizard dialog box, identify
the Output File location and file name, the start and end animation window, and the timer position and frame rate for the exported
file. Click OK to create the video.