Hydraulic Data
Hydraulic data is a critical component to computing life loss in LifeSim. Hydraulic data sources in LifeSim generally come from a two-dimensional hydraulic model, such as HEC-RAS (Hydrologic Engineering Center's [HEC] River Analysis System [RAS] software) (HEC, 2024) [?], FLO-2D (FLO-2D Software, Inc., Nutrioso, AZ) (FLO-2D, 2022) [?], or MIKE 21 (Danish Hydraulic Institute [DHI], Denmark) (DHI, 2018) [?]. New to LifeSim Version 2.0, hydraulic data can also be imported from USACE Engineer Research and Development Center's (ERDC) Adaptive Hydraulics Model (AdH) system (ERDC, 2024) [?]. Also new to LifeSim 2.0 is the ability to import summary grids. LifeSim will interpolate the depths and velocities between hydraulic time steps. A shorter hydraulic time step will generally provide more hydraulically accurate computations.
In addition to providing the time series of depth and velocity, if life loss is being assessed, then a hydrograph representing the hydraulic event must be provided as well. The hydrograph is critical in developing the warning issuance timing relative to a specific condition (e.g., dam or levee breach). This chapter covers the various ways to import, edit, and view hydraulic data.
Hydraulic Data Import Options
The five available options to import hydraulic data in LifeSim Version 2.1 and later are from HEC-RAS (*.pXX.hdf or *.hdf) files, FLO-2D files, gridded data (*.) files for depth and velocity, University of North Carolina's Advanced Circulation Model (ADCIRC) simulation output files (Luettich & Westerink, 2018) [?], and summary grids.
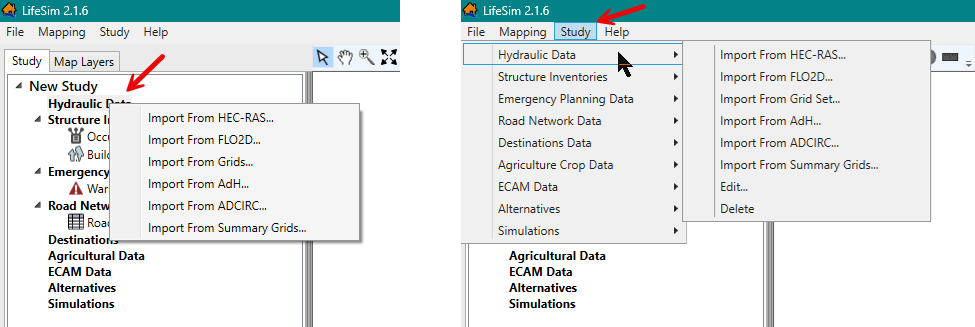
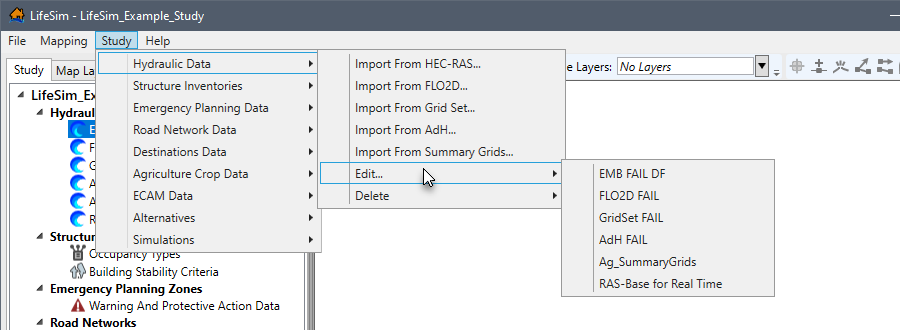
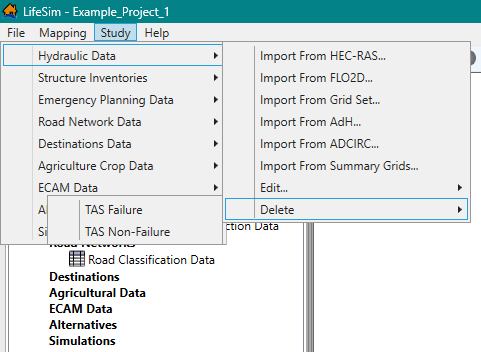
Open any of the hydraulic data import options: from the Study Tree under the Study tab, right-click Hydraulic Data to open the shortcut menu (Figure). Another way is from the LifeSim main window, from the Study menu on the Menu Bar, point to Hydraulic Data, and select the desired import option (Figure).
The import dialog for each hydraulic source contains the same general structure. The top portion of the hydraulic data import dialogs provide browser buttons for selecting the source file(s) and the bottom portion of the import dialog contains the Hydrograph Definition panel (Figure). Depending on the hydraulic data, importer the hydrograph definition panel provides two of three buttons as identified in Table.
| Hydraulic Summary Grid | Import From RAS | Import From Map | Manual Entry |
|---|---|---|---|
| Import from HEC-RAS | Available | Available | Available |
| Import from FLO-2D | Not Available | Not Available | Available |
| Import from Grid Set | Not Available | Not Available | Available |
| Import from AdH | Not Available | Not Available | Available |
| Import from ADCIRC | Not Available | Not Available | Available |
| Import from Summary Grids | Available | Not Available | Available |
Import from HEC-RAS
LifeSim has the ability to import hydraulic results directly from an HEC-RAS study as long as the HEC-RAS results were produced with HEC-RAS Version 5.0 or later. The ability to link directly with the hydraulic results and convert the hydraulic information is an efficient step in creating hydraulic data for a LifeSim study. LifeSim uses the HEC-RAS RASMapper.dll library to sample hydraulic information and create layers that can be viewed in the Map Window
Importing hydraulic data from a HEC-RAS study:
- Click Import From HEC-RAS using either method described in Hydraulic Data Import Options and Figure.
Option 1: From the Study Tree under the Study tab, right-click Hydraulic Data to open the shortcut menu (Figure)
Option 2: Study menu on the Menu Bar, point to Hydraulic Data, and select the desired import option (Figure).
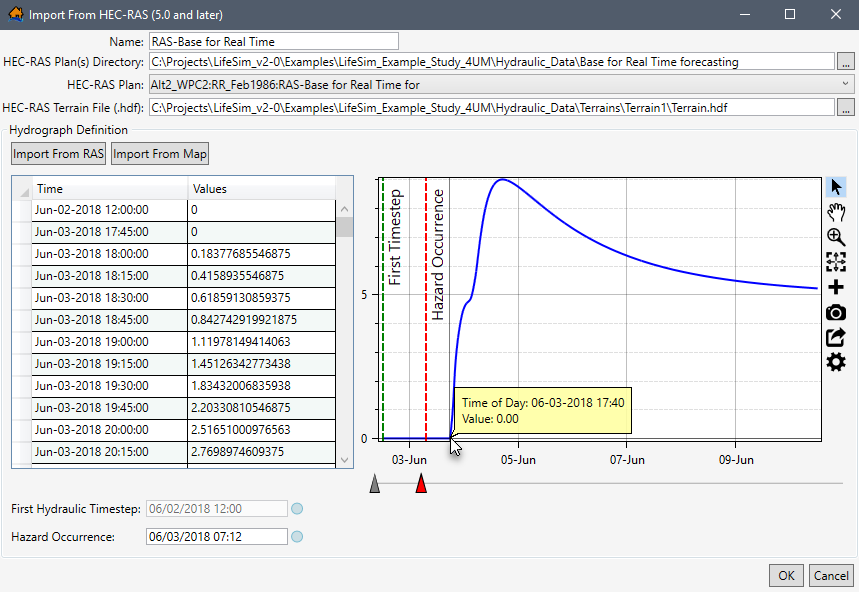
- Either way, the Import From HEC-RAS (5.0 and later) dialog box (Figure) opens.
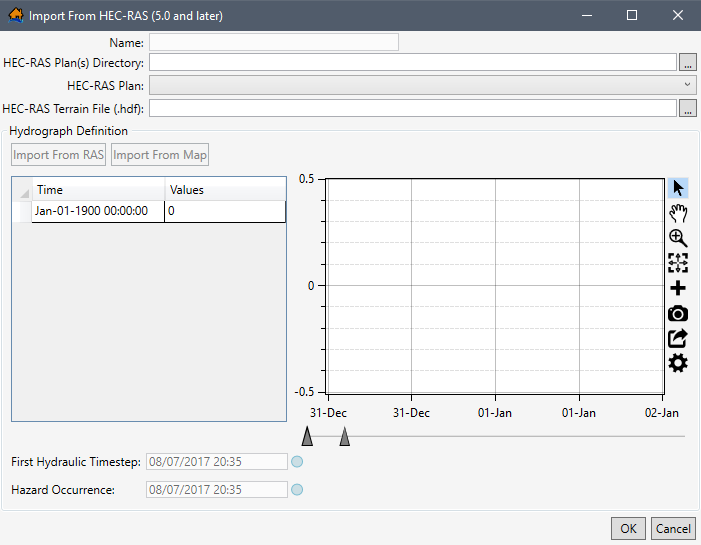
Figure: Import From HEC-RAS (5.0 and later) Dialog Box - To select the HEC-RAS output file, for the HEC-RAS Plan(s) Directory box, click
 and an Open Directory Containing RAS Output browser (Figure) will open. Navigate to the location of HEC-RAS plan output files; select the correct HEC-RAS plan output folder. The selected folder should contain the output files with the file extension *.hdf. Click Select Folder, and the Open Directory Containing RAS Output browser closes.
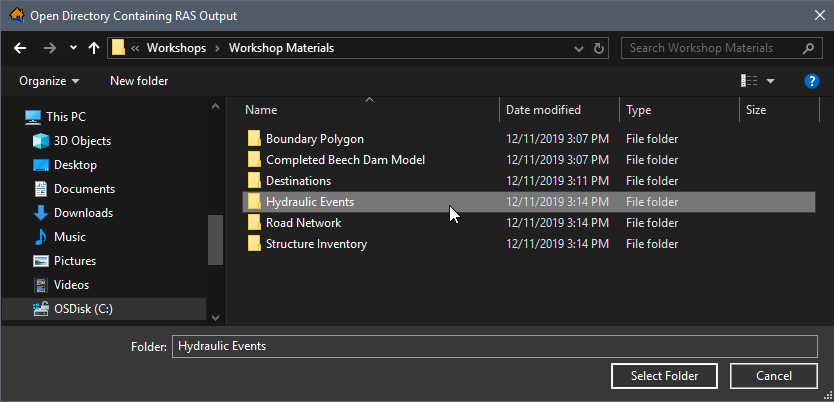
Figure: Open Directory Containing RAS Output Browser - The user is returned to the Import From HEC-RAS (5.0 and later) dialog box. The RAS Output Set Files Directory box updates with the location and the name of the HEC-RAS plan output file folder.
NOTE: if the wrong folder is selected, then the HEC-RAS Plan dropdown menu will be empty (Figure).
Figure: Empty HEC-RAS Plan Dropdown Menu if Lack of Data - Select the desired HEC-RAS file from the HEC-RAS Plan dropdown which contains the names of the HEC-RAS plan output files contained in the selected HEC-RAS output directory. By default, the name of the HEC-RAS plan output file is used as the name of the hydraulic dataset. The name appears in the Name box (Figure). The user can change the default name.
If there is an associated terrain file in the same location, then the HEC-RAS Terrain File (*.hdf) box will be automatically populated.
Figure: HEC-RAS Plan Dropdown Menu with Hydraulic Data - If the HEC-RAS terrain file is not located in the same place as the HEC-RAS plan output files, to the right of the HEC-RAS Terrain File (*.hdf) box, click. An Open browser opens. Navigate to the directory where the terrain file is located. Select the correct terrain file (e.g., *.hdf), click Open, the Open browser closes, and HEC-RAS Terrain File (*.hdf) box populates with the selected file.
- Next, the user can import the representative hydrograph (time series). Depending on the HEC-RAS output results file, two options are available for selecting a representative hydrograph: Import From RAS or Import From Map. Both options only work for HEC-RAS Version 5.0 and later output files. The representative hydrograph can be created from a cross section location or a storage area location. Users can also add the representative hydrograph manually. Review Create Hydrograph Manually for more information.
- The Hazard Occurrence information needs to be defined. First Hydraulic Timestep and Hazard Occurrence provides further details.
NOTE: the First Hydraulic Timestep is defined by the model output for only hydraulic data imported from the Import From HEC-RAS (5.0 and later) dialog box option. - Once all the data required to build a hydraulic dataset from HEC-RAS has been completed, click OK (Figure).
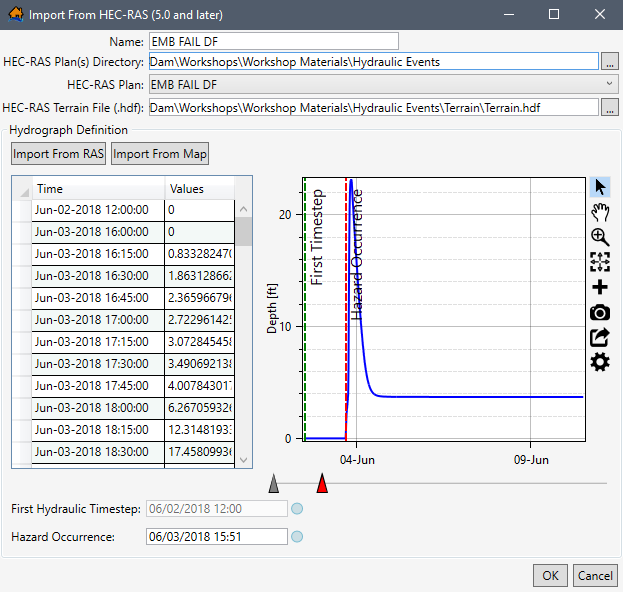
Figure: Example: Import From HEC-RAS (5.0 and later) Dialog Box – Completed - The Import From HEC-RAS (5.0 and later) dialog box closes, and a Progress Window opens displaying the progress of the import (Figure). Once complete, the hydraulic data is added to the study and displays in the Study Tree under Hydraulic Data.
Figure: Import From HEC-RAS (5.0 and later) Dialog Box – Completed - Progress Window
Import from FLO-2D
LifeSim has the ability to import hydraulic results directly from FLO-2D output files. The required FLO-2D output files are DEPTH.OUT and TIMDEP.OUT which can be generated automatically from a FLO-2D simulation. LifeSim will take the FLO-2D results files and convert them into a time series of depth and velocity compressed geotiff files. The geotiff files are stored in the hydraulics directory of the LifeSim study. The ability to link directly with the hydraulic results saves a huge step in converting hydraulic information to a software specific format.
To import hydraulic data from FLO-2D to an existing LifeSim study:
- Click Import From FLO-2D using either method described in Hydraulic Data Import Options and Figure.
Option 1: From the Study Tree under the Study tab, right-click Hydraulic Data to open the shortcut menu (Figure)
Option 2: Study menu on the Menu Bar, point to Hydraulic Data, and select the desired import option (Figure).
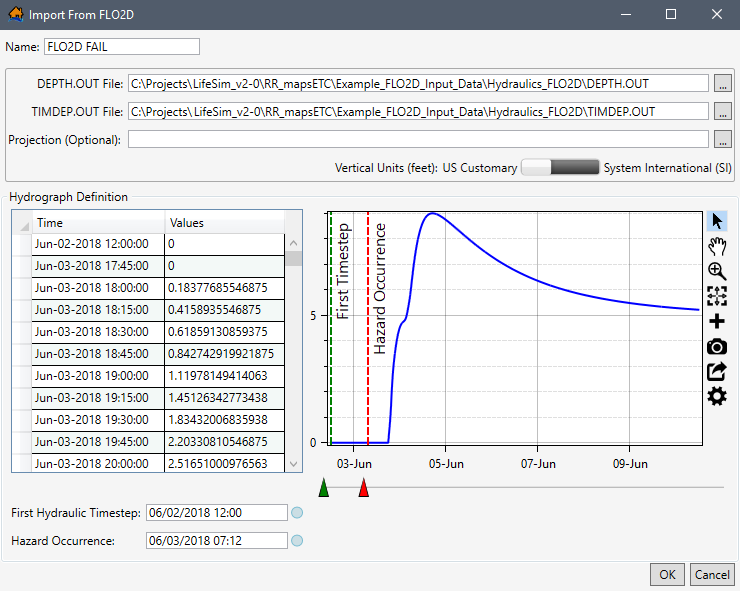
- Either way, the Import From FLO2D dialog box (Figure) opens. In the Name box, enter a name for the hydraulic data.
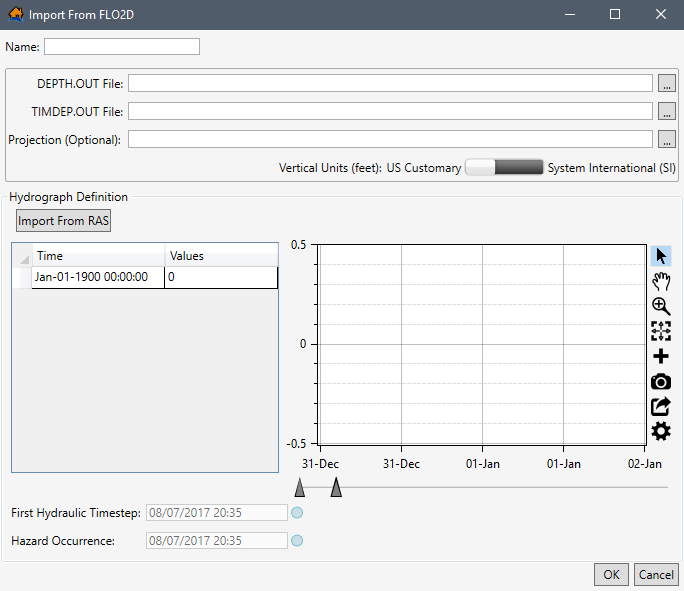
Figure: Import From FLO2D Dialog Box - In the DEPTH.OUT File box, click, and an Open browser (Figure) will open. Navigate to the directory where the hydraulic data (DEPTH.OUT) for the FLO-2D model is located. Select the correct FLO-2D output file (e.g.,*.OUT). Click Open, the Open browser closes, and the Import From FLO2D dialog box (Figure) updates to display the selected file location in the DEPTH.OUT File box.
- If the FLO-2D depth file (DEPTH.OUT) is not located in the same directory as the time of depth file (TIMDEP.OUT), to right of the TIMDEP.OUT File box, click, and an Open browser will open (Figure). Navigate to the directory where the hydraulic file (TIMDEP.OUT) is located and select the file (*.OUT). Click Open, the Open browser closes, and the Import From FLO2D dialog box updates to display the selected file location in the TIMEDEP.OUT File box (Figure).
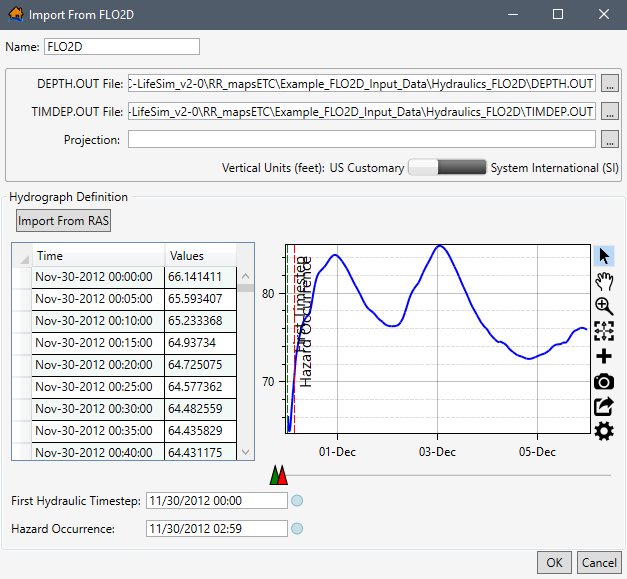
Figure: Import From FLO2D Dialog – Example Selected Time Series Data - The Projection box is available for selecting the geographic projection for the FLO-2D hydraulic data to be imported using an Esri® projection file format. The user may add the geographic projection by clicking, and an Open browser will open (Figure). Navigate to the location of the projection file (*.prj), click Open, and the Open browser closes and updates the Import From FLO2D dialog box (Figure) to display the selected projection file in the Projection box.
- Set the Vertical Units toggle
 to either US Customary (feet) or System International (SI) (meters) for the hydraulic data.
 - Next, add the representative hydrograph (time series) manually. Review Create Hydrograph Manually for more information.
- The First Hydraulic Timestep and the Hazard Occurrence information need to be defined next. Refer to First Hydraulic Timestep and Hazard Occurrence for further details.
- Click OK, and the Import From FLO2D dialog box closes. The hydraulic data is added to the study and displays in the Study Tree under Hydraulic Data.
Import from Grid Set
LifeSim has the ability to import hydraulic results (e.g., MIKE.21, DHI) directly from a time series of gridded files (grid set). Most hydraulic simulation engines can store depth and velocity grids as time series, which is an easy and convenient way to transfer hydraulic simulation data among various groups that may not have the hydraulic modeling software. LifeSim can import depth and velocity grids in several formats: *.flt, *.tif, and binary Esri® grids. When importing a grid set, LifeSim converts the gridded data into geotiff files which are stored in the hydraulics study directory.
To import hydraulic data, in a gridded format, to an existing LifeSim study:
- Click Import From Grid Set using either method described in Hydraulic Data Import Options and Figure.
Option 1: From the Study Tree under the Study tab, right-click Hydraulic Data to open the shortcut menu (Figure)
Option 2: Study menu on the Menu Bar, point to Hydraulic Data, and select the desired import option (Figure).
- Either way, the Import From Grid Set dialog box (Figure) opens. In the Name box, enter a name for the hydraulic gridded data.
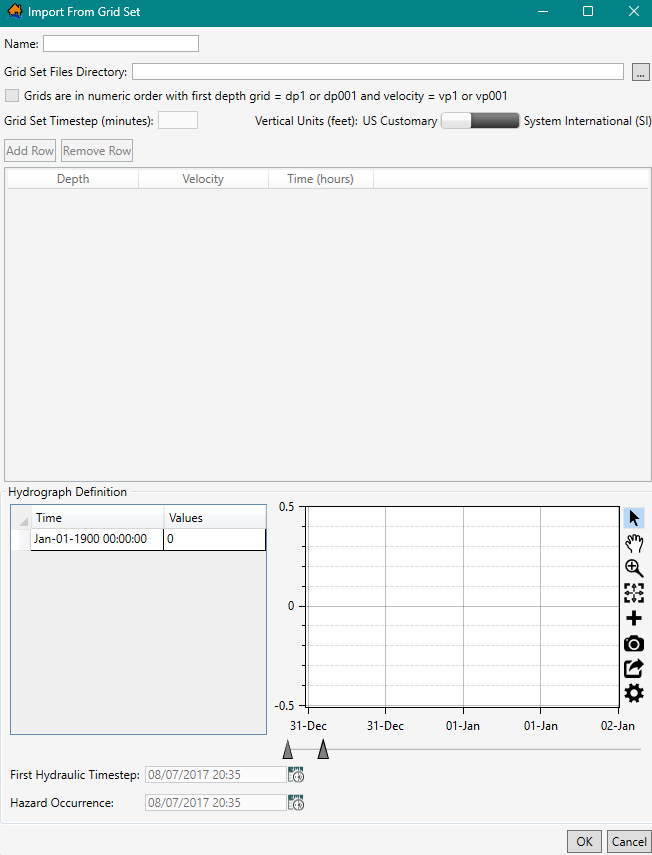
Figure: Import From Grid Set Dialog Box - To the right of the Grid Set Files Directory box, click , an Open Directory Containing grids browser opens (Figure). Navigate to the folder where the hydraulic grid data is located, select the correct folder, click Select Folder. The Open Directory Containing grids browser closes, and the Import From Grid Set dialog box updates to display the selected folder in the Grid Set Files Directory box.
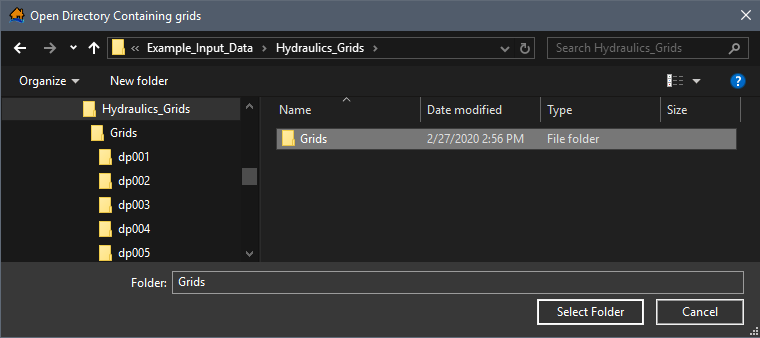
Figure: Open Directory Containing grids Browser Window - Next, if the depth grids are spaced at regular time intervals and are in a specific naming convention and numerical order, click the checkbox
 Grids are in numeric order with the first depth grid = dp1 or dp001 and velocity = vp1 or vp001. Only select this option if the Grid Set Timestep (minutes) is the same between each grid and the grids follow the specified naming convention of "depth grids being dp# and velocity grids being vp#" where # is 1 or 001 for the first grid and incrementing by one for each subsequent timestep. Enter the time interval separating the grids in the Grid Set Timestep (minutes) box.
 - If the gridded files do not satisfy the regular interval naming format, do not select Grids are in numeric order with the first depth grid = dp1 or dp001 and velocity = vp1 or vp001 and the Grid Set Timestep (minutes) box will remain disabled (grayed out). The user then must enter the Depth, Velocity, and Time (hours) in the table. Click the Add Row and Remove Row buttons to add a row or remove a row in the Depth, Velocity, and Time (hours) table. Rows will always be either added or removed from the bottom of the table.
- Set the Vertical Units toggle to either US Customary (feet) or System International (SI) (meters) for the hydraulic data.
- Next, add the representative hydrograph (time series) manually. Review Create Hydrograph Manually for more information.
- The First Hydraulic Timestep and the Hazard Occurrence information need to be defined next. Refer to First Hydraulic Timestep and Hazard Occurrence for further details.
- Once all of the data has been entered (Figure), click OK, and the Import From Grid Set dialog box closes. The hydraulic data is added to the study and displays in the Study Tree under Hydraulic Data.
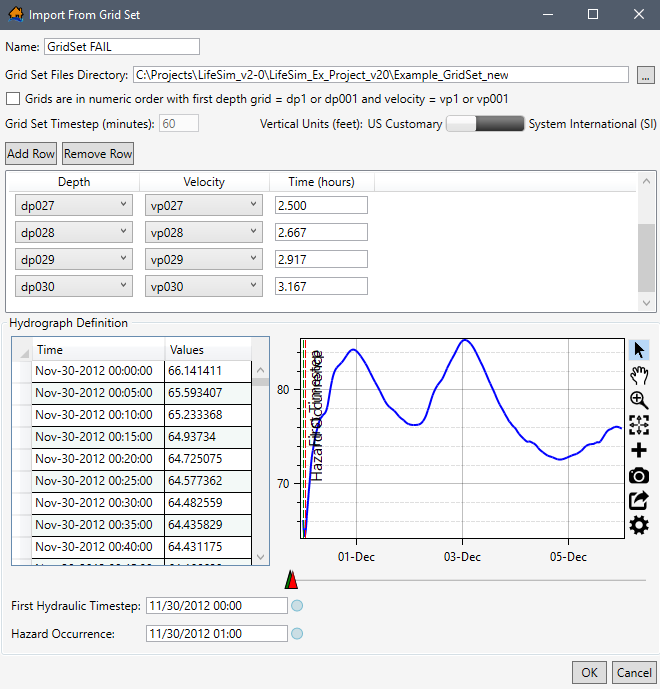
Figure: Import From Grid Set Dialog Box – Completed Example
Import from AdH
LifeSim has the ability to import hydraulic results from ERDC’s Adaptive Hydraulics (AdH) computational tool simulation output files. LifeSim will take the AdH results files and convert them into a TIN mesh time series of depth and velocity. The TIN and time series data are stored in the hydraulics directory of the LifeSim study. The ability to link directly with the hydraulic results saves a huge step in converting hydraulic information to a software specific format.
To import hydraulic data, from AdH, to an existing LifeSim study:
- Click Import From AdH using either method described in Hydraulic Data Import Options and Figure.
Option 1: From the Study Tree under the Study tab, right-click Hydraulic Data to open the shortcut menu (Figure)
Option 2: Study menu on the Menu Bar, point to Hydraulic Data, and select the desired import option (Figure).
- Either way, the Import From AdH dialog box (Figure) opens. In the Name box, enter a name for the hydraulic data.
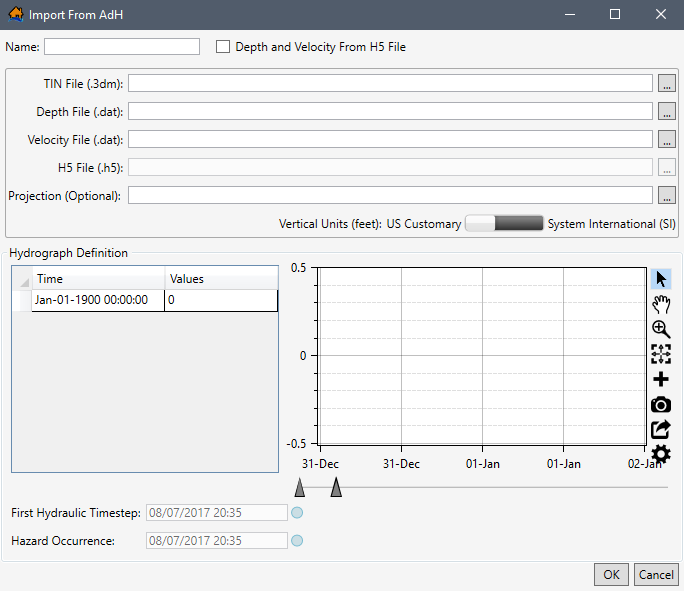
Figure: Import From AdH Dialog Box - Next to the TIN File (.3dm) box, click , and an Open browser opens (Figure). Navigate to the folder where the AdH mesh data is located, select the correct TIN File (*.3dm) file, and click Open. The Open browser closes, and the Import From AdH dialog box updates the TIN File (.3dm) box.
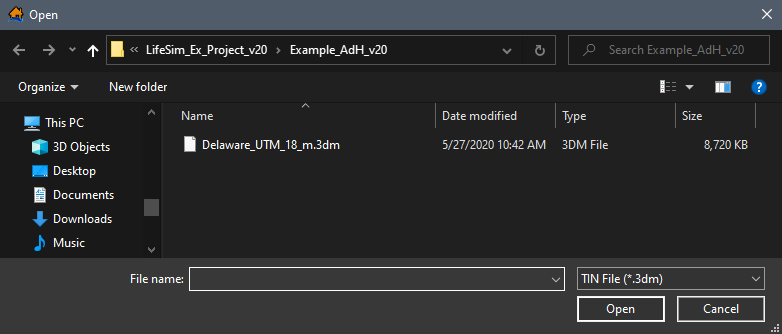
Figure: AdH Open Browser Window - If the Depth File (.dat) and Velocity File (.dat) or H5 File (.h5) files are saved in the same location as the TIN file, then the input files populate automatically after selecting the TIN file. If not, click for each file and from the Open browser window (Figure), locate and select the appropriate files, and click Open.
- Alternatively, if the depth and velocity data is contained in the H5 (*.h5) AdH output file, check the
 Depth and Velocity From H5 File checkbox. Then next to the H5 File (.h5) box, click . From the Open browser window, locate and select the appropriate H5 (*.h5) file, and click Open. The Open browser closes, and the Import From AdH dialog box updates to display the selected folder in the H5 File (.h5) box.
 - Set the Vertical Units toggle to either US Customary (feet) or System International (SI) (meters) for the hydraulic data.
- Next, add the representative hydrograph (time series) manually. Review Create Hydrograph Manually for more information.
- The First Hydraulic Timestep and the Hazard Occurrence information need to be defined next. Refer to First Hydraulic Timestep and Hazard Occurrence for further details.
- Once all of the data has been entered (Figure), click OK, and the Import From AdH dialog box closes. The hydraulic data is added to the study and displays in the Study Tree under Hydraulic Data.
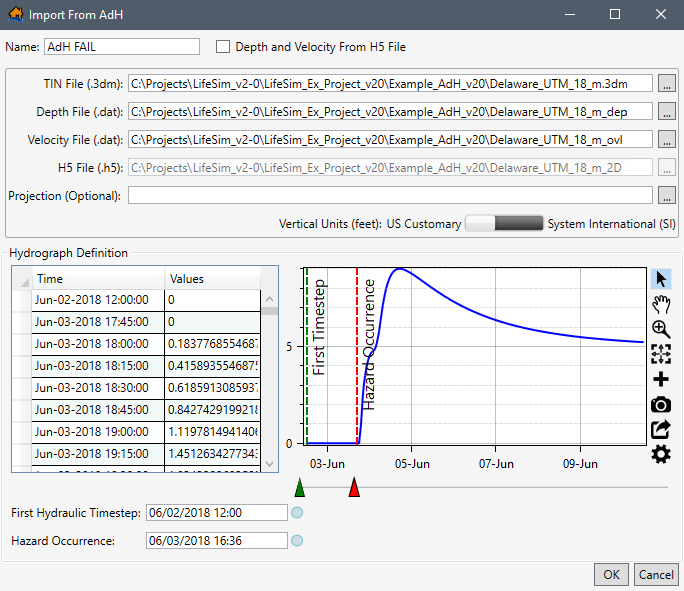
Figure: Import From AdH – Completed Example
Import from ADCIRC
LifeSim has the ability to import hydraulic results from the University of North Carolina’s Advanced Circulation Model (ADCIRC) simulation output files. LifeSim will take the ADCIRC results files and convert them into a TIN mesh time series of depth and velocity. The TIN and time series data are stored in the hydraulics directory of the LifeSim study. The ability to link directly with the hydraulic results saves a huge step in converting hydraulic information to a software specific format.
To import hydraulic data, from ADCIRC, to an existing LifeSim study:
- Click Import From ADCIRC using either method described in Hydraulic Data Import Options and Figure.
Option 1: From the Study Tree under the Study tab, right-click Hydraulic Data to open the shortcut menu (Figure)
Option 2: Study menu on the Menu Bar, point to Hydraulic Data, and select the desired import option (Figure).
- Either way, the Import From ADCIRC dialog box (Figure) opens. In the Name box, enter a name for the hydraulic data.
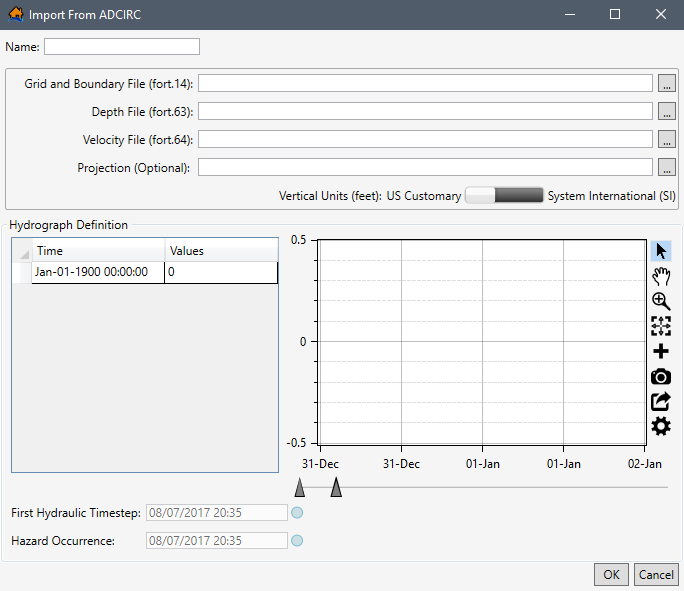
Figure: Import From ADCIRC Dialog Box - Next to the Grid and Boundary File (fort.14) box, click , and an Open browser (Figure) opens. Navigate to the folder where the ADCIRC mesh data is located, select the correct TIN File (*.14) file, and click Open. The Open browser closes, and the Import From ADCIRC dialog box updates the Grid and Boundary File (fort.14) box.
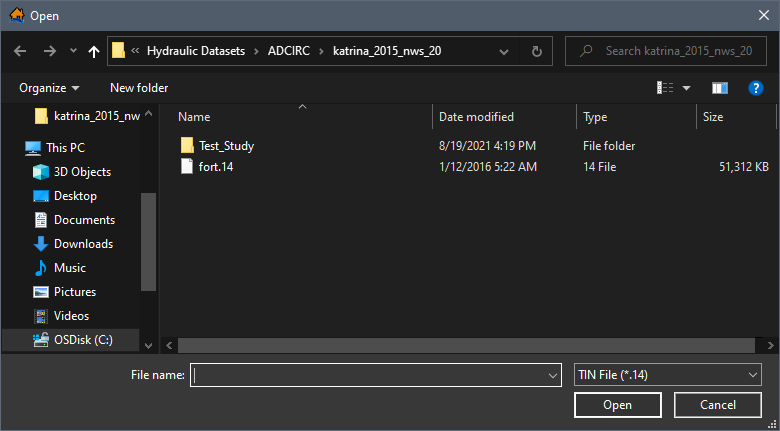
Figure: ADCIRC Open Browser Window - If the Depth File (fort.63) and Velocity File (fort.64) files are saved in the same location as the TIN file, then the input files populate automatically after selecting the TIN file (Figure). If not, click for each file from the Open browser window, locate and select the appropriate files, and clickOpen.
- Set the Vertical Units toggle to either US Customary (feet) or System International (SI) (meters) for the hydraulic data.
- Next, add the representative hydrograph (time series) manually. Review Create Hydrograph Manually for more information.
- The First Hydraulic Timestep and the Hazard Occurrence information need to be defined next. Refer to First Hydraulic Timestep and Hazard Occurrence for further details.
- Once all of the data has been entered (Figure), click OK, and the Import From ADCIRC dialog box closes. The hydraulic data is added to the study and displays in the Study Tree under Hydraulic Data.
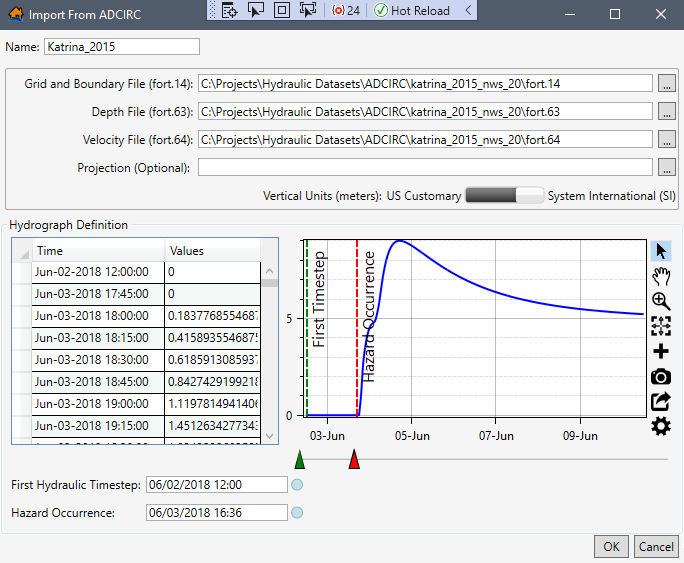
Figure: Import From ADCIRC – Completed Example
Import from Summary Grids
LifeSim has the ability to import hydraulic data from summary grids (raster files). Importing summary grids bypasses the need for LifeSim to calculate hydraulic characteristics. LifeSim can import summary grids in several formats: *.flt, *.tif, and *.vrt. The five hydraulic characteristics that can be represented by summary grids are maximum depth, maximum velocity, non-evacuation arrival time, first-inundated arrival time, and duration inundated. Depending on the target consequence estimate (e.g., structure damages, life loss, agricultural damages), specific hydraulic characteristics are required (Table).
LifeSim stores imported summary grid files in the hydraulics study directory.
| Hydraulic Summary Grid | Structural Damages | Life Loss | Agricultural Damages |
|---|---|---|---|
| Maximum Depth | Required | Required | Not Applicable |
| Maximum Velocity | Optional | Optional | Not Applicable |
| Non-Evacuation Depth Arrival Time | Not Applicable | Required | Not Applicable |
| First-Inundated Arrival Time | Not Applicable | Optional | Required |
| Duration Inundated | Not Applicable | Not Applicable | Required |
To import hydraulic data, in a gridded format, to an existing LifeSim study:
- Click Import From Summary Grids using either method described in Hydraulic Data Import Options and Figure.
Option 1: From the Study Tree under the Study tab, right-click Hydraulic Data to open the shortcut menu (Figure)
Option 2: Study menu on the Menu Bar, point to Hydraulic Data, and select the desired import option (Figure).
- Either way, the Import From Summary Grids dialog box (Figure) opens. In the Name box, enter a name for the hydraulic data.
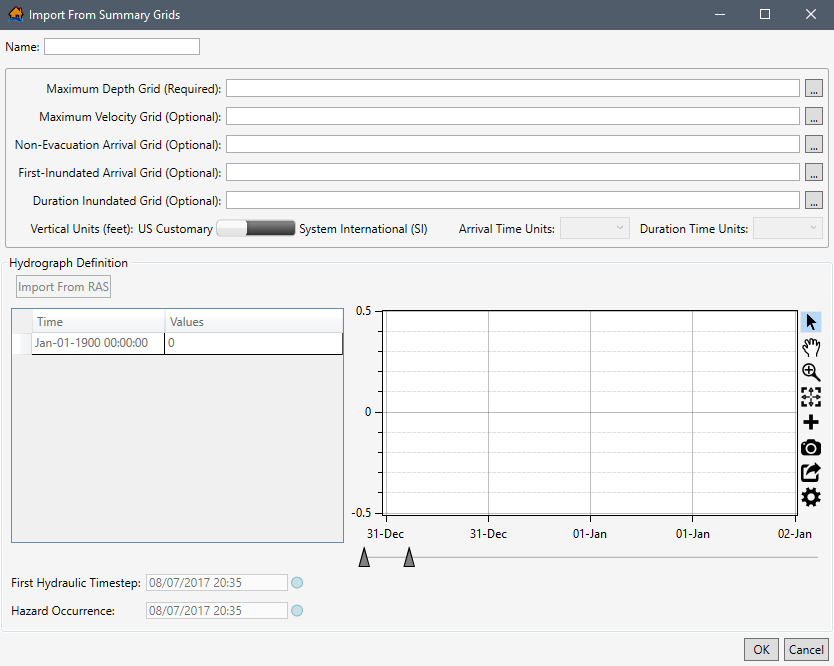
Figure: Import From Summary Grids Dialog Box - To the right of the Maximum Depth Grid (Required) box, click , and an Open browser opens. Navigate to the folder containing the hydraulic summary grid (*.flt, *.tif, and *.vrt), select the correct file and file type (e.g., FLOAT File [*.flt]), and click Open. The Open browser closes, and the Import From Summary Grids dialog box displays the selected file in the Maximum Depth Grid box.
- Continue to select the desired summary grids to import by clicking the Browse To button, navigating to the desired summary grid, selecting the grid, and clicking Open. The Import From Summary Grids dialog box displays the selected files (Figure).
- Set the Vertical Units toggle to either US Customary (feet) or System International (SI) (meters) for the hydraulic data.
- If a summary grid is selected for the Non-Evacuation Arrival Grid (Optional) and/or the First-Inundated Arrival Grid (Optional), then the Arrival Time Units
 box is enabled. From the Arrival Time Units list, select the correct units (Seconds, Minutes, Hours, Days) for the selected arrival grids. If both Non-Evacuation and First-Inundated grids are supplied, it will be assumed that they both have the same time units.
 - If a summary grid is selected for the Duration Inundated Grid (Optional), then the Duration Time Units box is enabled. From the Duration Time Units list, select the correct units (Seconds, Minutes, Hours, Days) for the selected arrival grids.
- Next, create the representative hydrograph by clicking the Import From RAS button or by adding the hydrograph time series manually. Review Import from RAS and Create Hydrograph Manually for more information.
- The First Hydraulic Timestep and the Hazard Occurrence information need to be defined next. Refer to First Hydraulic Timestep and Hazard Occurrence for further details.
- Once all of the data has been entered (Figure), click OK, and the Import From Summary Grids dialog box closes. The hydraulic data is added to the study and displays in the Study Tree under Hydraulic Data.
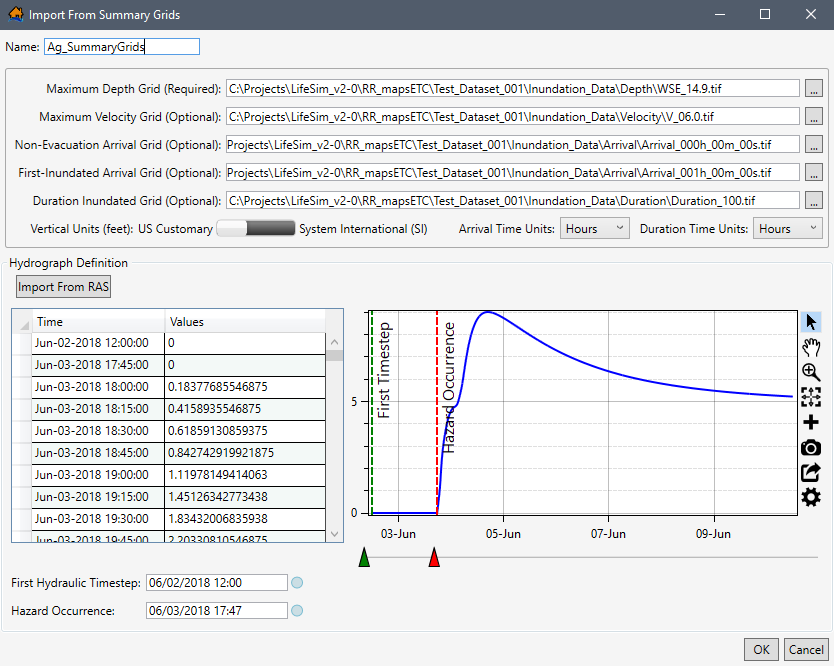
Figure: Import From Summary Grids – Completed Example
Representative Hydrograph
In addition to providing the time series of depth and velocity (review Hydraulic Data Import Options), a hydrograph representing the hydraulic event must be provided as well for performing life loss calculations. The representative hydrograph is critical in developing the warning issuance timing relative to a specific condition (e.g., dam or levee breach). However, the hydrograph is for visualization purposes only and is not used in the simulation engine. The representative hydrograph can be created by importing the hydrograph from HEC-RAS data, import from a map (created from the HEC-RAS hydraulic data that has been imported), or by entering the hydrograph time series data manually.
Import from RAS
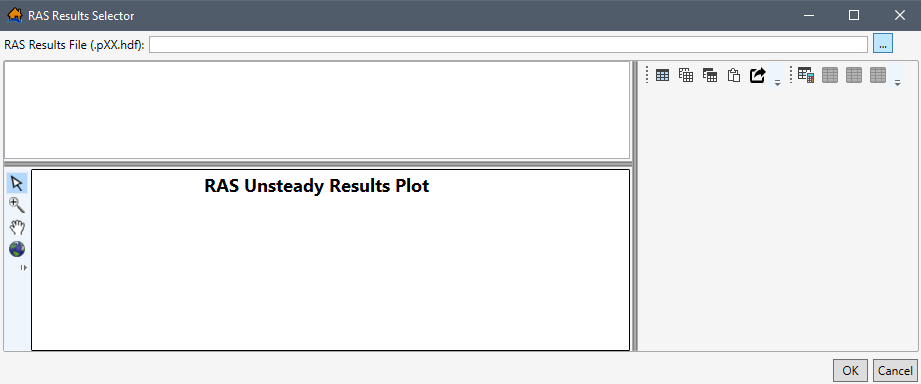
The representative hydrograph can be created by importing the hydrograph from HEC-RAS data. Many of the hydraulic data import options described in Hydraulic Data Import Options include the option to select the representative hydrograph from HEC-RAS Version 5.0 (and later) output data by clicking the Import From RAS button (Figure) to open the RAS Results Selector (Figure) dialog box.
To select the representative hydrograph from HEC-RAS (5.0 or later) results:
- From the RAS Results File (*.pXX.hdf) box, click. An Open browser opens. Navigate to the directory where the HEC-RAS output file is located. Select the correct RAS results file (*.pXX.hdf), and click Open. The Open browser will close, and the selected file opens in the RAS Results Selector. The representative hydrograph can be created from a cross section location or a storage area location.
- To create the representative hydrograph from an HEC-RAS cross section location, from the RAS Results Selector dialog box (Figure), click
 to expand the Cross Sections list (Figure). From the expanded list, select the HEC-RAS cross section that contains the representative hydrograph (e.g., Russian - DCtoOcean - 8693.624 in Figure).
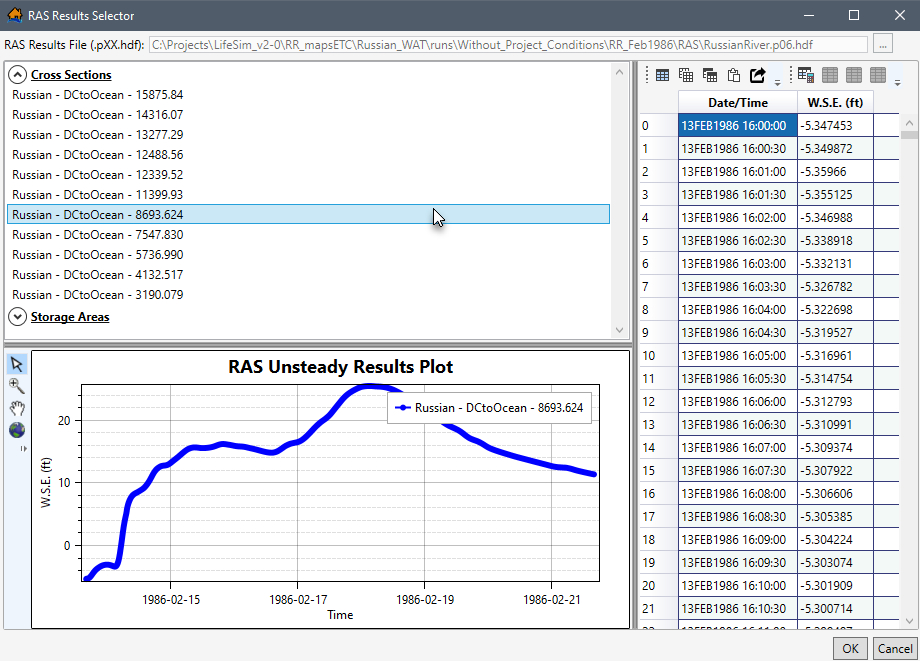
Figure: RAS Results Selector Dialog Box – Hydrograph from a Cross Section - Alternatively, to create the representative hydrograph from an HEC-RAS storage area location, from the RAS Results Selector dialog box (Figure), click to expand the Storage Areas list (Figure). Select the HEC-RAS storage area that contains the representative hydrograph.
- The RAS Unsteady Results Plot located at the bottom of the RAS Results Selector dialog box displays the hydrograph for the selected cross section or storage area (Figure). The table section, located on the right side of the RAS Results Selector, displays the time series data for the representative hydrograph. Refer to LifeSim Interface for details regarding map window tools, table tools, and customizing plots and plotting tools.
- Once the desired representative hydrograph is located and displayed, click OK. The RAS Results Selector dialog box closes, and the selected hydrograph displays in the hydraulic data import dialog in the Hydrograph Definition panel (Figure).
- From the Hydrograph Definition panel (Figure), users can adjust the first hydraulic timestep and hazard occurrence for the representative hydrograph. For details on adjusting the First Hydraulic Timestep and the Hazard Occurrence, refer to First Hydraulic Timestep and Hazard Occurrence.
Import from Map
Another way to import the representative hydrograph from HEC-RAS Version 5.0 (and later) data, is from a "map" view of the data. Import from HEC-RAS map data is only available from the Import From HEC-RAS (5.0 and later) dialog box (Figure) described in Import from HEC-RAS.
To select the representative hydrograph from HEC-RAS map data, from the Import From HEC-RAS (5.0 and later) dialog box, click the Import From Map button (Figure) to open the RAS Map Data Selector dialog box (Figure).
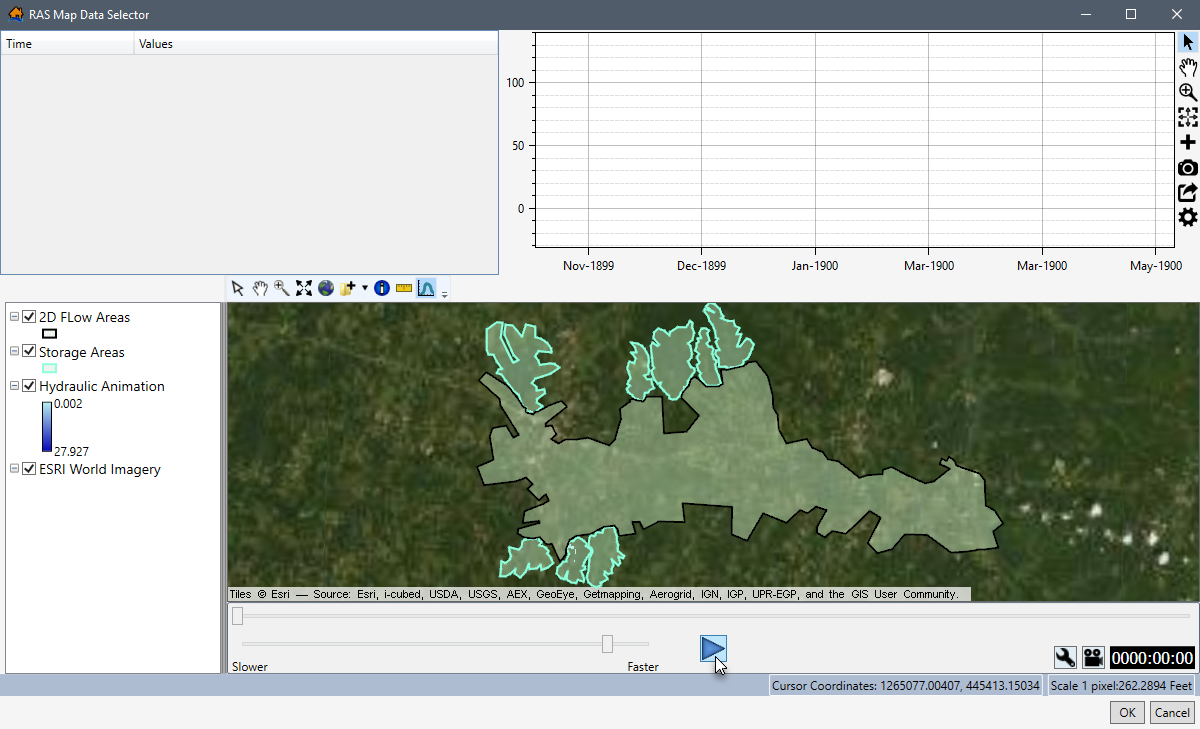
The RAS Map Data Selector (Figure) allows the user to specify a time series of depth at any point in
the HEC-RAS study area. This method is generally used when no detailed information is given regarding hazard occurrence timing relative to an HEC-RAS
geometric feature. Using the Select Hydrograph
 tool, the user can select a cross
section or storage area on the map, and the data for the hydrograph from that selection area will appear.
tool, the user can select a cross
section or storage area on the map, and the data for the hydrograph from that selection area will appear.
Refer to LifeSim Interface for
details regarding map window tools, table tools, customizing plots and plotting tools, and the animation toolbar.
However, the Select Hydrograph
tool is unique to the RAS Map Data
Selector dialog box (Figure). This tool is the default selection upon opening the RAS Map Data Selector
dialog box. This tool is what allows the user to specify a time series of depth at any point in the HEC-RAS
study area.
To select the representative hydrograph from HEC-RAS (5.0 or later) results, from the RAS Map Data Selector
dialog box, drag the slider  or click the play
 button to start the animation in
the map window. At the desired water depth, pause the animation, and click the Select Hydrograph
tool. From the map window, click on a
location in the study area, and a Progress Window opens. The Progress Window
will show the collection of depth time series data for that selected point (Figure).
button to start the animation in
the map window. At the desired water depth, pause the animation, and click the Select Hydrograph
tool. From the map window, click on a
location in the study area, and a Progress Window opens. The Progress Window
will show the collection of depth time series data for that selected point (Figure).
Once the desired representative hydrograph is displayed in the table and plot window, click OK. The RAS Map Data Selector dialog box closes, and the selected representative hydrograph is used for the hydraulic import. From the hydraulic data import dialog box (e.g., Figure), the user can adjust the First Hydraulic Timestep and/or the Hazard Occurrence start time (see First Hydraulic Timestep and Hazard Occurrence).
Create Hydrograph Manually
Regardless of the hydraulic data import option used, the representative hydrograph can be created manually by entering the data by hand or copying and pasting the data from an external source such as another hydraulic dataset or from another application (e.g., Microsoft Excel, HEC-DSSVue).
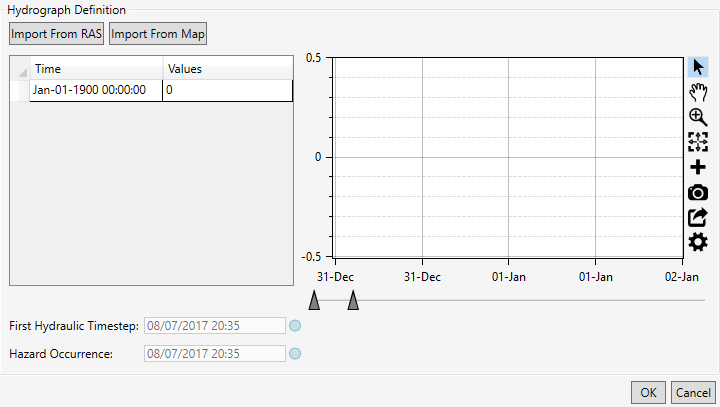
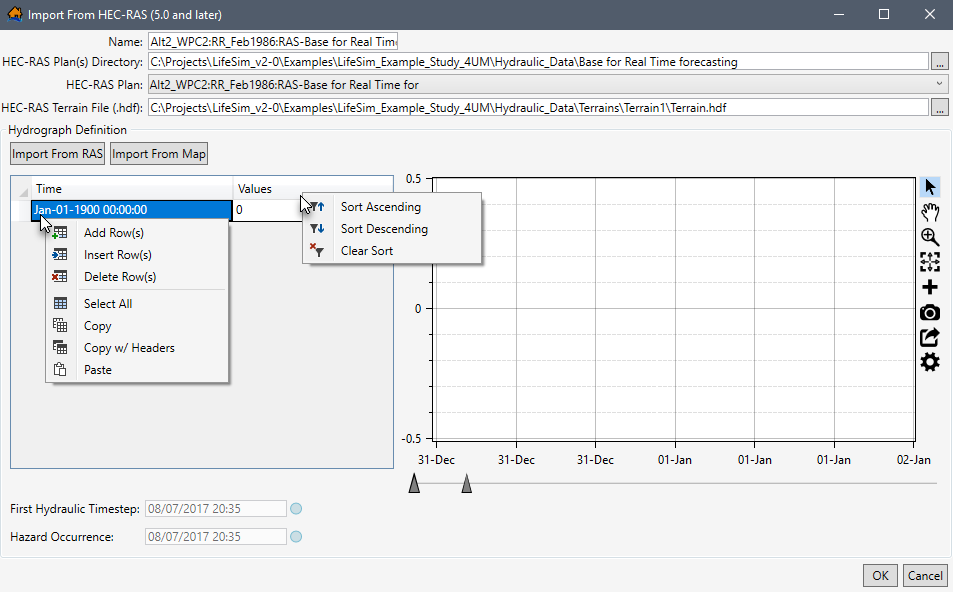
From the Hydrograph Definition panel (see within Figure) – available from all hydraulic data import options described in Hydraulic Data Import Options – users can enter the representative hydrograph manually in the Time and Values table. The date and time variable must be entered as: MMM-DD-YYYY HH:MM:SS (e.g., Jan-01-1900 00:00:00 in Figure).
From another hydraulic dataset or application (e.g., Microsoft Excel), data can be pasted into the table (i.e., entire table, individual cells, columns, rows). From the Time and Values table (Figure), right-click to open the shortcut menu. From the shortcut menu, the user can Add Row(s), Insert Row(s), Delete Row(s), Select All, Copy, Copy w/ Headers, and Paste.
e.g., From another application (e.g., Microsoft Excel), select the date and value range of cells in the Excel spreadsheet and use Ctrl + C (or the Copy shortcut menu command) to copy the data to the clipboard. Return to LifeSim to the Time and Values table (Figure) and select the first cell in the first row. Use Ctrl + V to paste all the copied data (Figure).
The hydrograph time series data can also be copied (with or without headers) into another application (e.g., Microsoft Excel) for saving. Use Ctrl + A (or the Select All command from the shortcut menu) on the Time and Values table, right-click, and select Copy w/ Headers. Then paste the data into the desired application to save.
The Hydrograph Definition panel (e.g., within Figure) contains a plot window that provides a live update for the data entered in the table. Review Customizing Plots and Plotting Tools for instructions on using the general plotting tools (located on the right side of the plot window) and for customizing plots.
When the desired hydrograph data has been entered manually in the hydraulic data import dialog, from the Hydrograph Definition panel (e.g., within Figure), users can adjust the first hydraulic timestep and hazard occurrence for the representative hydrograph. To continue and complete the First Hydraulic Timestep and the Hazard Occurrence start time adjusted, refer to First Hydraulic Timestep and Hazard Occurrence.
First Hydraulic Timestep and Hazard Occurrence
For all hydraulic data import options described in Hydraulic Data Import Options – following the hydraulic data import selection and selection of the representative hydrograph – the first hydraulic timestep and time of hazard occurrence (e.g., dam breach) must be set within the Hydrograph Definition panel (e.g., within Figure).
Defining the First Hydraulic Timestep and Hazard Occurrence are critical for LifeSim to correctly calculate hydraulic timing in relation to warning and evacuation information during the simulation. The first hydraulic timestep represents the start of the hydraulic data (time 0) that has been imported. All hydraulic timing information will be calculated relative to the first hydraulic timestep. The hazard occurrence time represents the time that the hazard occurs within the timeline. All warning and evacuation assumptions will be relative to the hazard occurrence time.
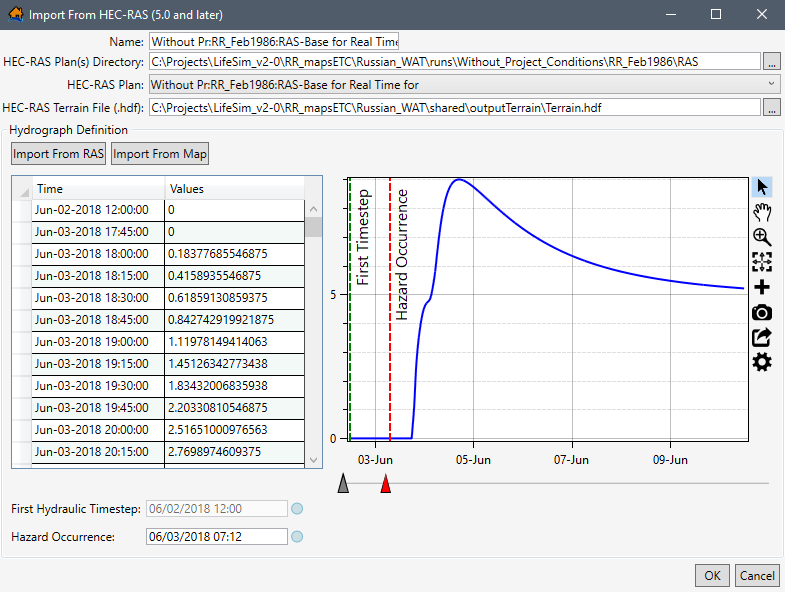
Once the representative hydrograph has been entered, the first hydraulic timestep can be modified. The first hydraulic timestep can be modified for
all hydraulic data import dialogs (Figure), except the Import From HEC-RAS (5.0 and later)
(Figure) option. For the example in Figure, note that the First
Timestep plot slider is green
 and can be moved. However, for
the example provided in Figure, note that the First Timestep plot slider is gray
and can be moved. However, for
the example provided in Figure, note that the First Timestep plot slider is gray
 and cannot be moved. Likewise,
the First Hydraulic Timestep date and time box is disabled in Figure, but is not disabled (and can be
edited) in Figure.
and cannot be moved. Likewise,
the First Hydraulic Timestep date and time box is disabled in Figure, but is not disabled (and can be
edited) in Figure.
Instead, when the representative hydrograph is set using the Import From RAS option, the first hydraulic timestep is defined by the model output. All other hydraulic data import options allow the First Hydraulic Timestep and the Hazard Occurrence start time to be adjusted by the user.
Users can set the first hydraulic timestep and hazard occurrence using the following options:
-
Enter the date and time manually. The date and time variable must be entered as: MM/DD/YYYY HH:MM (e.g., 06/03/2018 07:12 in Figure).
-
Alternatively, use the green First Timestep
plot slider and red
Hazard Occurrence  plot slider (Figure) to adjust the green and red dotted lines on the time series plot.
 -
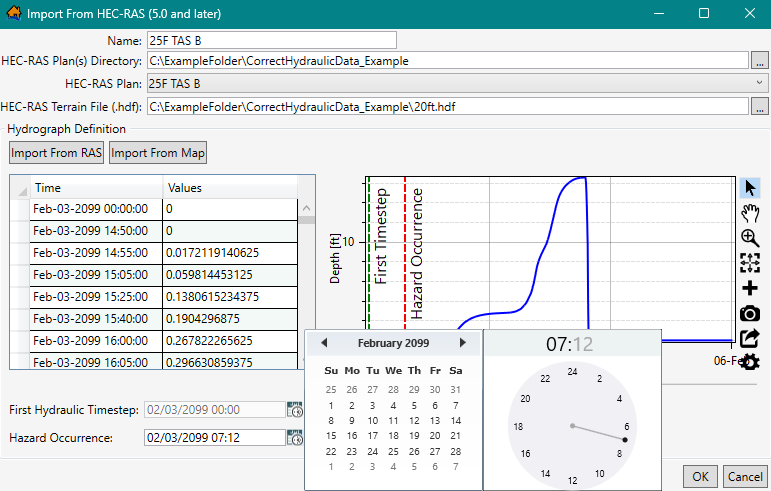
Users can also adjust the first hydraulic timestep and hazard occurrence by clicking the
 button that opens a calendar and
time adjustment window (Figure). From the calendar panel, select the date. Use
the left and right arrows to select a preceding or subsequent month. From the time panel, first select the hour
(displayed in military time), then select the minutes. To modify the hour or minutes selection, click the displayed hour header (e.g.,
07 in Figure) or the displayed minute header (e.g., 12 in
Figure).
button that opens a calendar and
time adjustment window (Figure). From the calendar panel, select the date. Use
the left and right arrows to select a preceding or subsequent month. From the time panel, first select the hour
(displayed in military time), then select the minutes. To modify the hour or minutes selection, click the displayed hour header (e.g.,
07 in Figure) or the displayed minute header (e.g., 12 in
Figure).
Once all of the appropriate information has been entered, click OK. The hydraulic data importer dialog box closes, and the hydraulic data is added to the study and displays in the Study Tree (Figure) under Hydraulic Data.
Editing, Viewing, and Removing Hydraulic Datasets
Once hydraulic data has been added to the LifeSim study, a hydraulic dataset can be edited, deleted, viewed, moved, or a hydraulic summary of the data can be generated.
To access the editing options, from the LifeSim main window, from the Study menu, point to Hydraulic Data, and point to Edit. The hydraulic datasets added to the study will be shown as options, e.g., EMB FAIL DF, FLO2D FAIL, etc. in Figure.
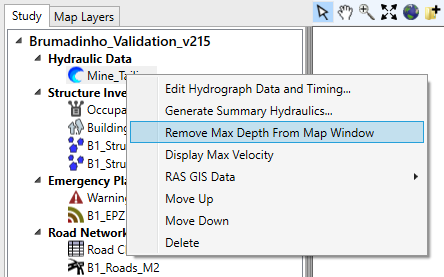
Alternatively, users can access the edit options for an individual hydraulic dataset from the LifeSim main window, from the Study tab, from the Study Tree, under Hydraulic Data, right-click on a hydraulic dataset (e.g., TAS Failure in Figure). From the pop-up shortcut menu (Figure), click Edit Hydrograph Data and Timing.
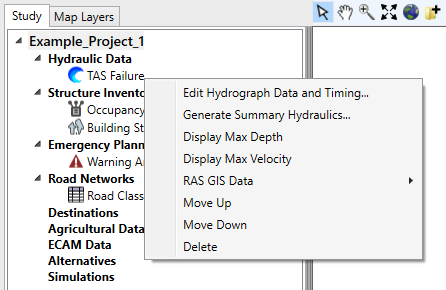
Other shortcut menu options include delete, view, move, or generate a hydraulic summary for an individual hydraulic dataset. The following sections describe how to perform the various function on an individual hydraulic dataset.
Edit a Hydraulic Dataset
To edit a hydraulic dataset:
- Select edit from the two options listed previously: from the LifeSim main window, from the Study menu, point to Hydraulic Data, point to Edit, and select the appropriate hydraulic dataset (Figure). The other way is from the LifeSim main window, from the Study tab, from the Study Tree, under Hydraulic Data, right-click on a hydraulic dataset (e.g., TAS Fail in Figure). From the pop-up shortcut menu, click Edit Hydrograph Data and Timing. Alternatively, from the Study Tree, under Hydraulic Data, double-click on a hydraulic dataset.
- The Select Hydrograph and Timing Information For "hydraulic dataset" dialog box opens (Figure).
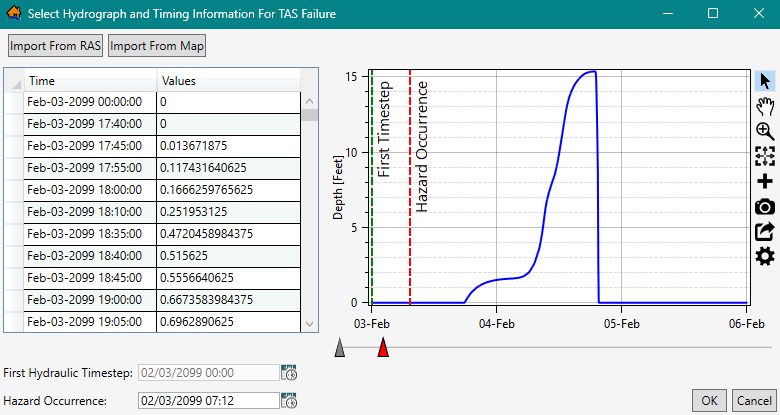
Figure: Select Hydrograph and Timing Information for "hydraulic dataset" Dialog Box - From the Select Hydrograph and Timing Information For "hydraulic dataset" dialog box (Figure), users can replace existing representative hydrographs. Depending on the hydraulic data source, the user can click Import From RAS (Import from RAS), Import From Map (Import from Map), or can be entered manually (Create Hydrograph Manually).
- The time series data table, First Hydraulic Timestep (when enabled), and Hazard Occurrence can be modified (see First Hydraulic Timestep and Hazard Occurrence).
- Once editing of the hydraulic data is complete, click, OK, and the Select Hydrograph and Timing Information For "hydraulic dataset" dialog box closes.
Generate Hydraulic Summary
The user can create an output shapefile based on any selected hydraulic scenario for point or polyline shapefiles. The created output shapefile contains hydraulic information based on the selected scenario such as maximum depth, velocity, and key hydraulic threshold arrival times at each feature in the selected point (e.g., structure inventory) or polyline (e.g., roads) shapefile. The hydraulic summary data can be useful in identifying potential issues in a structure inventory or road network; for example, structures inundated too quickly due to bad placement or bridges that have water underneath prior to the start of the flood event.
To generate the hydraulic summary:
- From the LifeSim main window, from the Study tab, from the Study Tree, under Hydraulic Data, right-click on a hydraulic dataset (e.g., TAS Failure in Figure). From the shortcut menu (Figure), click Generate Summary Hydraulics.... The Generate Hydraulic Summary dialog box opens (Figure).
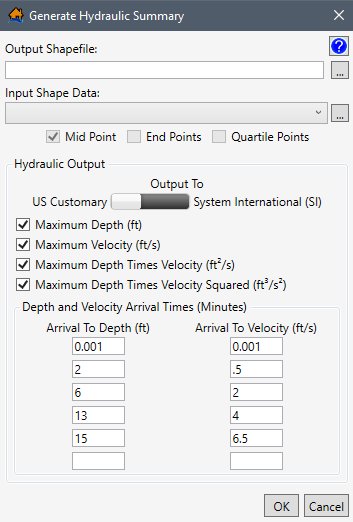
Figure: Generate Hydraulic Summary Dialog Box - The user needs to provide a name and a location to save the output shapefile. To the right of the Output Shapefile box (Figure), click, and a Save As browser opens (Figure). Navigate to the directory to save the output shapefile. Enter a name for the output shapefile in the File name box (*.shp) and click Save. The Save As browser closes, and the Output Shapefile box in the Generate Hydraulic Summary dialog box (Figure) updates to display the pathname and shapefile name of the output shapefile.
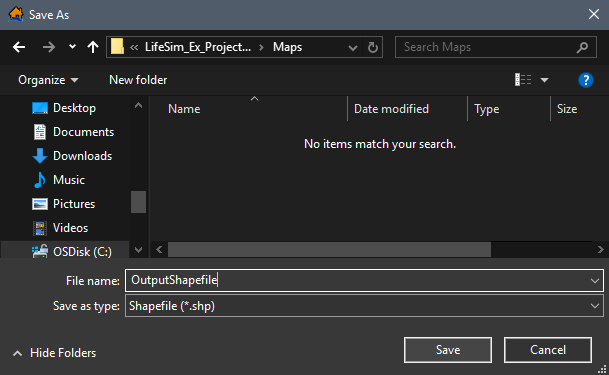
Figure: Save As Browser - Under Input Shape Data (Figure), select the dropdown list to select the desired point or polyline shapefile. If no point or polyline dataset exists in the map window, then to select the Input Shape Data, to the right of the list (Figure), click. An Open browser opens (Figure). Navigate to the directory where the point or polyline shapefile is located. Select the correct shapefile (e.g., *.shp), click Open, the Open browser closes, and the user returns to the Generate Hydraulic Summary dialog box (Figure).
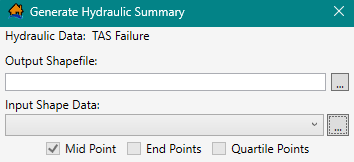
Figure: Generate Hydraulic Summary – Input Shape Data 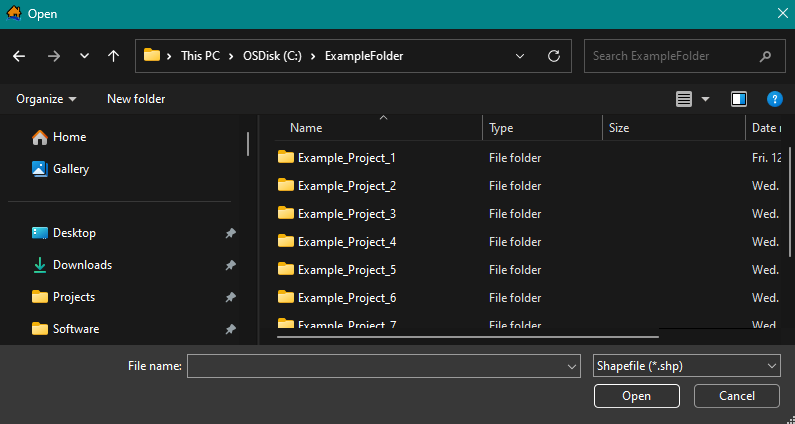
Figure: Open Browser - For the selected polyline Input Shape Data, identify how the hydraulic summary should be generated either at the Mid Point (default, and automatically selected for point shapefiles), End Point, and/or Quartile Points (Figure).
- In the Hydraulic Output panel (Figure), set the Output To units to either US Customary or System International (SI). Units are either in feet or meters and depend on the Output To selection. In other words, if the hydraulic data is in feet and System International (SI) is selected, then the resulting output will be converted to meters.
- By default, in the Hydraulic Output panel (Figure), the Maximum Depth, Maximum Velocity, Maximum Depth Times Velocity, and Maximum Depth Times Velocity Squared hydraulic output options have been selected
 . To unselect a default output selection, uncheck the checkbox for the option.
 - From the Depth and Velocity Arrival Time (Minutes) panel (Figure), default values for Arrival To Depth and Arrival To Velocity have been set. The default values can be modified, but no more than six boxes per arrival time type can be identified per output shapefile. Not all six boxes require data.
- Once all of the necessary and desired parameters have been set, click OK. A Progress Window opens (Figure) showing the progress of the hydraulic summary output shapefile creation. When processing of the output shapefile is complete, the Progress Window (Figure) closes. The created hydraulic summary output shapefile is saved in the appropriate location and displays in the map window.
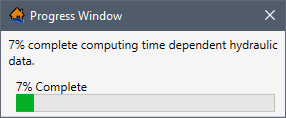
Figure: Progress Window
View a Hydraulic Dataset
Depending on which method was chosen to import hydraulic datasets for a LifeSim study, the user can view hydraulic datasets in the map window. To display a hydraulic dataset feature in the Map Window, select the Study tab, from the Study Tree, under Hydraulic Data, right-click on an imported hydraulic dataset (e.g., TAS Failure in Figure). From the pop-up shortcut menu (Figure), click Display "hydraulic dataset feature".
In general, the available display options are:
-
Display Max Depth (LifeSim created Max_Depth.vrt and *.tif files)
-
Display Max Velocity (LifeSim created Max_Velocity.vrt and *.tif files)
If the hydraulic data is imported from HEC-RAS data, then from the LifeSim main window (Figure), from the Study tab, from the Study Tree, under Hydraulic Data, right-click on a hydraulic dataset (e.g., TAS Failure in Figure). From the pop-up shortcut menu, point to RAS GIS Data (Figure) and the shortcut sub-menu will display one or more of the following options:
-
Display Cross Sections (LifeSim created shapefile (*.shp) file)
-
Display Storage Areas (LifeSim created shapefile (*.shp) file)
-
Display 2D Flow Areas (LifeSim created shapefile (*.shp) file)
-
Display Hydrograph Selection Point (LifeSim created shapefile (*.shp) file)
NOTE: the above files are created in the Hydraulic_Data sub-directory when the files are added to the map window.
To remove a hydraulic dataset feature displayed in the map window, from the LifeSim main window, from the Study tab, under Hydraulic Data, right-click on a hydraulic dataset. From the popup shortcut menu, click Remove "hydraulic dataset feature" From Map Window (Figure). Or remove the map layer from the Map Window (Appendix B).
Move a Hydraulic Dataset
To move specific hydraulic datasets up or down in the Study Tree:
- From the LifeSim main window, from the Study tab, from the Study Tree, under Hydraulic Data, right-click on a hydraulic dataset (e.g., TAS Non-Failure in Figure). From the popup shortcut menu, click Move Up. The selected dataset will move up one layer in the Study Tree (Figure). To move the selected dataset down, from the shortcut menu, click Move Down.
Figure: Study Tree - Hydraulic Dataset - Move Up - Datasets can also be moved in the Study tab by utilizing the drag and drop method. From the Study Tree, click and hold on the dataset of interest. The user can move the selected dataset up or down the list by moving the mouse. A bar will show the new location where selected dataset will be moved. Release the mouse to set the selected dataset at the desired location (Figure).
Figure: Study Tree - Hydraulic Dataset - Drag and Drop
Delete a Hydraulic Dataset
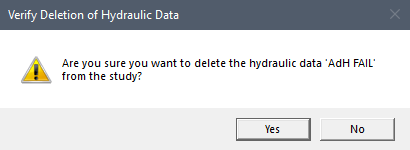
From the LifeSim main window, from the Study tab, from the Study Tree, under Hydraulic Data, right-click on a hydraulic dataset. From the popup shortcut menu, click Delete (Figure).
Another way is from the LifeSim main window, from the Study menu, point to Hydraulic Data, point to Delete, and select the appropriate hydraulic dataset (Figure).
The Verify Deletion of Hydraulic Data message dialog (Figure) opens. To verify the deletion of the selected hydraulic data, from the Verify Deletion of Hydraulic Data message dialog, click Yes. The selected dataset will be removed from the study. Alternatively, click No to close the Verify Deletion of Hydraulic Data message dialog without deleting the hydraulic data.