
Emergency Planning Data
The next step in building a LifeSim study is to add emergency planning data which represents an area (or areas) with potentially unique overall evacuation effectiveness such as evacuation preparedness, community awareness, and the types of flood warning systems available. Refer to Sorensen et al. (2014a, 2014b, 2014c) [?] [?] [?] for examples of how to define an emergency planning zone (EPZ) or area. The effectiveness of the warning systems available and the anticipated community responses is captured in community diffusion curves for first warning alert and protective action initiation (sometimes called mobilization).
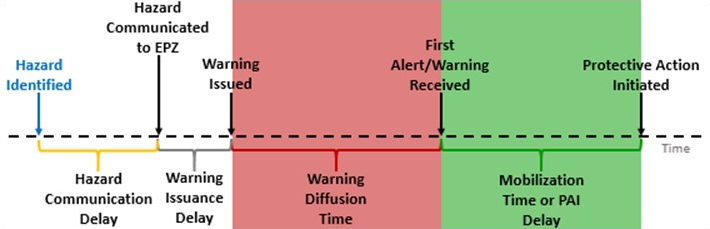
Central to the evacuation process in LifeSim are the first alert and Protective Action Initiation (PAI) community diffusion curves (Figure). The first alert curves represent the percentage of the population that receives a notification of the warning over time (e.g., fifty percent of the population will receive a warning alert within forty minutes of warning issuance). First alert curves are entered for daytime and night-time scenarios because the speed at which a first alert can be received can vary significantly between daytime and night-time. The PAI curves represent the percent of population that takes protective action over time. For example, fifty percent of the population will have taken protective action within eight minutes of a first alert (Sorensen & Mileti, 2014c) [?]. The diffusion curves can be entered with uncertainty and LifeSim performs curve sampling on an iteration basis in the Monte Carlo simulation.
Warning And Protective Action Data Editor
The Warning And Protective Action Data Editor (Figure) allows users to edit pre-set warning and evacuation parameters that were developed using the findings of Sorensen & Mileti (2015) [?]. Users are able to adjust these parameters or create new warning and evacuation parameters to better reflect the specific situation in the study area. Modifications made in the Warning And Protective Action Data Editor (Figure) is available for all emergency planning zone datasets in the Emergency Planning Zone Editor (discussed in EPZ Editor).
Overview
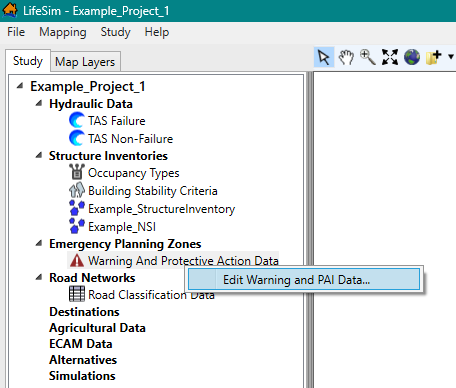
Open the Warning And Protective Action Data Editor (Figure). From the Study Tree, under Emergency Planning Zones, right-click Warning And Protective Action Data. From the shortcut menu, click Edit Warning and PAI Data (Figure).
The Warning And Protective Action Data Editor (Figure) contains three tabs: Warning Issuance Delay, First Alert, and Protective Action Initiation; each tab is discussed in Warning Issuance Delay, First Alert Curves, and Protective Action Initiation (PAI); respectively. The tabs contain the same buttons for adding, deleting, and copying existing warning and evacuation parameters and plot windows for viewing the warning and protective action curves. Review Customizing Plots and Plotting Tools for instructions on using the general plotting tools (located on the right side of the plot window) and for customizing the plots.
Buttons
- Add New
 allows a user to create a warning issuance delay, first alert relationship, or new protective action initiation relationship. For example, clicking the Add New button from the First Alert tab (Figure) will open a Name of New First Alert Relationship dialog box (Figure). In Name box, enter a name for the new warning issuance delay, first alert relationship, or new protective action initiation relationship. Click OK, the Name of New First Alert Relationship dialog box closes and the new warning issuance delay, first alert relationship, or new protective action initiation relationship is created.
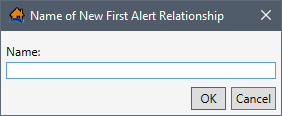
Figure: Name of New First Alert Relationship Dialog Box - Delete
 allows the user to delete selected warning issuance delay, first alert relationship, or new protective action initiation relationship. From the Warning And Protective Action Data Editor (Figure), select a warning issuance delay, first alert relationship, or new protective action initiation relationship from the dropdown menu (e.g., Well Prepared in Figure). Click Delete, and a Confirm Delete window opens asking the user for confirmation to delete the selected item (such as Figure). Click Yes to close the Confirm Delete message window and delete the selected warning issuance delay, first alert relationship, or new protective action initiation relationship.
Figure: Warning And Protective Action Data Editor - Confirm Delete Dialog Box - Copy
 allows the user to copy a warning issuance delay, first alert relationship, or new protective action initiation relationship with a new name. From the Warning And Protective Action Data Editor (Figure), select a warning issuance delay, first alert relationship, or new protective action initiation relationship from the dropdown menu (e.g., Well Prepared in Figure). For example, from the Warning Issuance Delay tab, click Copy, and the Name of New Warning Issuance Delay dialog box (Figure) opens. By default, the selected warning and evacuation parameters name is entered in the Name box and appended with “_Copy". Keep the default name or enter a new name in the Name box. Click OK, the Name of New Warning Issuance Delay dialog box closes, and the new copied warning issuance delay, first alert relationship, or new protective action initiation relationship is created.
Figure: Copy – Name of New Warning Issuance Delay Dialog Box - Reset Default Warning Issuance Delay Relationships
 allows the user to reset any edits made to the warning issuance delay, first alert curves, and protective action initiation relationships back to the original defaults. After an edit was made, click Reset Default Warning Issuance Delay Relationships, and a Confirm Restore dialog box opens (Figure). Click Yes and any changes made to the existing default functions will be overwritten with the default values. Click No to cancel and close the dialog box.
Figure: Warning And Protective Action Data Editor - Restore Default - Confirm Restore Dialog Box
Warning Issuance Delay
The Warning Issuance Delay tab (Figure) allows the user to create a new or edit an existing pre-set warning issuance delay. The warning issuance delay is the time it takes from when the emergency managers receive the notification of the imminent hazard -- or imminent hazard ID time (review Compute Options for an Alternative) -- to when an evacuation order is issued to the public.
Create a New Warning Issuance Delay
To create a new warning issuance delay:
- Click the Add New button (Figure). The Name of New Warning Issuance Delay dialog box (similar to Figure) opens.
- In Name box, enter a name for the new warning issuance delay. Click OK, and the Name of New Warning Issuance Delay dialog box closes and the new warning issuance delay is created.
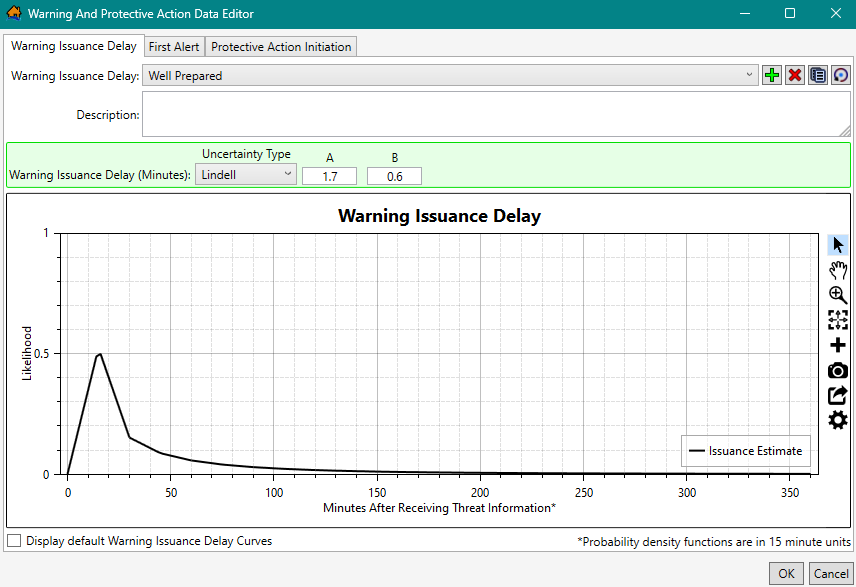
- From the Warning Issuance Delay (Minutes) green panel (Figure), select the desired uncertainty type from the Uncertainty Type dropdown menu and define the amount of time (in minutes) it is estimated to take for the emergency managers to issue the warning to the public. The uncertainty options include:
- None: (most likely).
- Lindell: (A, B).
- Triangular: (minimum, most likely, maximum).
- Normal: (most likely, standard deviation).
- Uniform: (minimum, maximum).
- For example, if the emergency manager for an EPZ took anywhere between 15 to 30 minutes to verify the hazard and initiate a public evacuation order, then the user would enter a warning issuance delay function with a uniform distribution (as in Figure).

Figure: Warning Issuance Delay – Uniform Uncertainty Type Example - Click OK to save the new warning issuance delay and close the Warning And Protective Action Data Editor (Figure).
Edit a Warning Issuance Delay
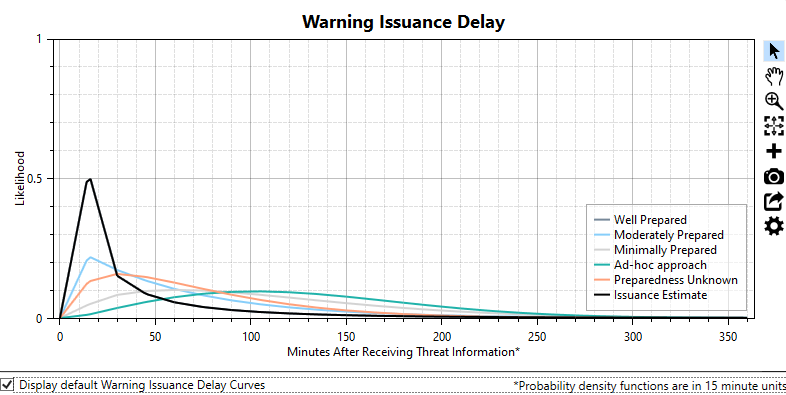
To edit an existing warning issuance delay, select the desired warning issuance delay name from the Warning Issuance Delay dropdown menu (e.g., Well Prepared in Figure). From the Warning Issuance Delay (Minutes) panel, select the desired uncertainty type from the Uncertainty Type dropdown menu (Figure) and define the amount of time (in minutes) it is estimated to take for the emergency managers to issue the warning to the public.
To view all of the default warning issuance delay curves, check the
checkbox  to Display default Warning Issuance Delay Curves; all
the default curves will display in the Warning Issuance Delay plot window (Figure). Click OK to save the new warning issuance
delay and close the Warning And Protective Action Data Editor.
to Display default Warning Issuance Delay Curves; all
the default curves will display in the Warning Issuance Delay plot window (Figure). Click OK to save the new warning issuance
delay and close the Warning And Protective Action Data Editor.
First Alert Curves
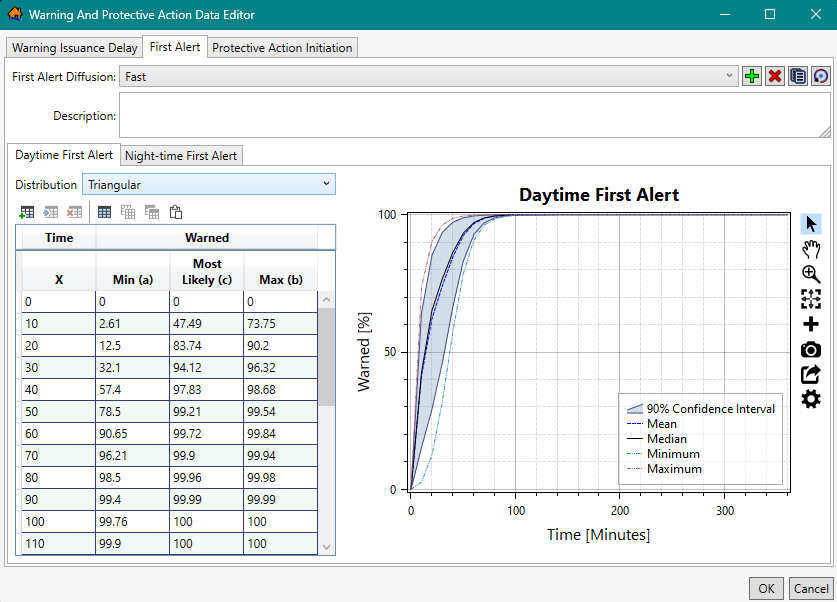
From the Warning And Protective Action Data Editor (Figure), select the First Alert tab (Figure). The first alert curves, alternatively known as warning diffusion (Figure), represent the percentage of the population that receives a notification of the warning over time (e.g., fifty percent of the population will receive a warning alert within forty minutes of warning issuance). First alert curves are entered for daytime (from the Daytime First Alert tab) and night-time (from the Night-time First Alert tab) scenarios because the speed at which a first alert can be received can vary significantly between daytime and night-time.
Daytime First Alert
The Daytime First Alert tab (Figure) allows the user to set a unique (for multiple zones, when present) warning system with uncertainty to define the diffusion curve. The diffusion curve represents the percentage of the population which will receive a first alert warning over time during daytime hours from when the warning was issued and can be described with uncertainty (e.g., Triangular in Figure).
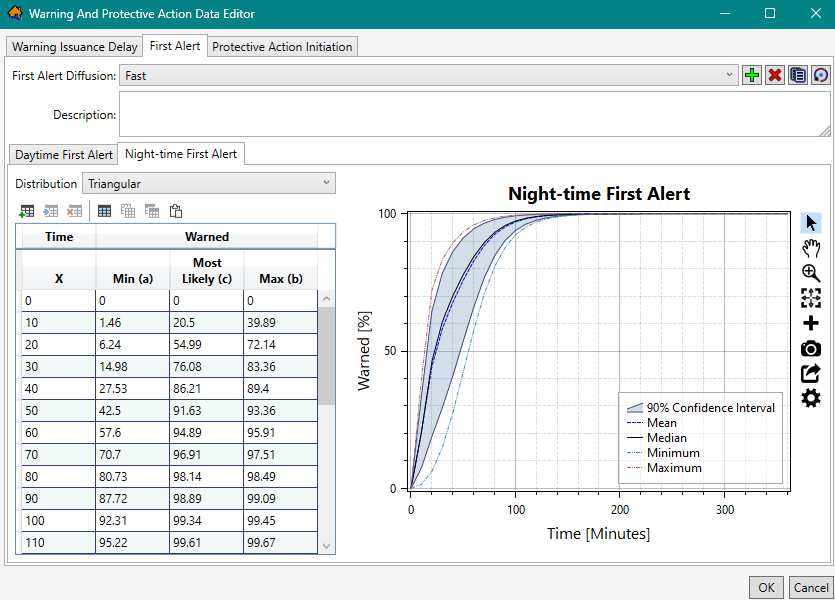
Night-time First Alert
The Night-time First Alert tab (Figure) allows the user to set a unique (for multiple zones, when present) warning system with uncertainty to define the diffusion curve. The diffusion curve represents the percentage of the population which will receive a first alert warning over time during night-time hours from when the warning was issued and can be described with uncertainty. The default curves take into account the challenges with sending out a warning at night (Figure) compared to daytime.
Create New First Alert Diffusion Curves
To create a new set of first alert diffusion curves:
- From the First Alert tab (Figure), click the Add New button. The Name of New First Alert Relationship dialog box (Figure) opens.
- In Name box, enter a name for the new first alert relationship. Click OK, and the Name of New First Alert Relationship dialog box (Figure) closes and the new first alert relationship is created.
- From the Daytime First Alert tab (Figure), select the desired distribution from the Distribution dropdown menu. The distribution options include:
- None: (percent warned).
- Log-Normal: mean (of log, μ), standard deviation (of log, σ).
- Normal: mean (μ), standard deviation (σ).
- PERT: minimum (a), most likely (c), maximum (b).
- Triangular: minimum (a), most likely (c), maximum (b).
- Uniform: (minimum, maximum).
- Define the daytime diffusion curve by entering the time (minutes) and percent warned in the Daytime First Alert time-warned table (Figure). Diffusion curve values can be entered by hand or copied from another application (e.g., Microsoft Excel®) and pasted into the table (i.e., entire table, individual cells, columns, rows). From the Daytime First Alert table, right-click to open the shortcut menu (Figure). From the shortcut menu, the user can Add, Insert, and Delete Row(s); Select All; Copy or Copy with Headers; and Paste.
The daytime first alert table can also be copied (with or without headers) into another application (e.g., Microsoft Excel®) for saving. Use Ctrl + A (or the Select All command from the shortcut menu), right-click, and select Copy w/ Headers. Then paste the data in the desired application to save.
Errors in the daytime diffusion curve are highlighted in red in the table and a tooltip displays a message describing the error (as in Figure). Right-click on a header row to open the shortcut menu (Figure) to sort the table in ascending or descending order, or clear the table sorting.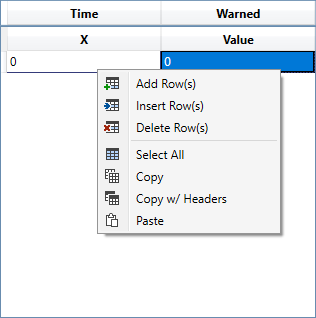
Figure: Warning And Protective Action Data Editor – First Alert Tab – Table Shortcut Menu - Next, from the Night-time First Alert tab (Figure), select the desired distribution from the Distribution dropdown menu. The distribution options are the same as in the Daytime First Alert tab (see step #3).
- Define the night-time diffusion curve by entering the time (minutes) and percent warned in the Night-time First Alert table (Figure).
- Click OK to save the new first alert diffusion curves and close the Warning And Protective Action Data Editor (Figure).
Edit First Alert Diffusion Curves
Diffusion curves can be edited for both the daytime and night-time first alert curves or individually modified. To edit existing first alert diffusion curves, select the desired diffusion curve set from the First Alert Diffusion dropdown menu (e.g., Fast in Figure). Select the appropriate tab (Daytime First Alert tab or Night-time First Alert tab), and either begin editing the values in the table or select the desired distribution from the Distribution dropdown menu and define the first alert diffusion curve. Click OK to save edits and close the Warning And Protective Action Data Editor (Figure).
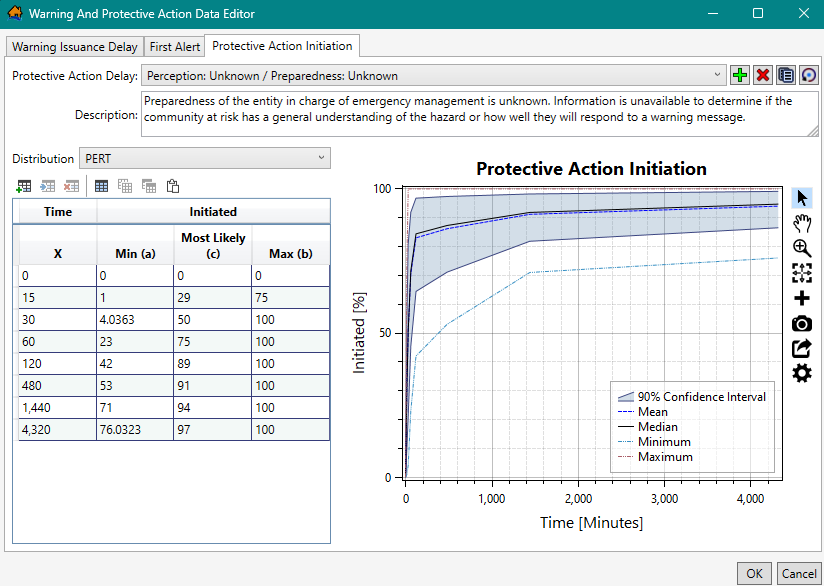
Protective Action Initiation (PAI)
The Protective Action Initiation tab (Figure) allows the user to define new or edit existing mobilization protective action initiation (PAI) delay diffusion curve with or without uncertainty. The PAI delay represents the percentage of the population which will take protective action over time from when the first alert is received (Figure). During the PAI delay, people are confirming the severity of the situation, packing, notifying others, protecting property, gathering family and pets, etc.
LifeSim provides nine default PAI delay curves; the curves are categorized based on a combination of three emergency management agency preparedness categories and three categories defining the public perception of the level of risk.
The emergency management agency preparedness categories are:
-
Unknown: This is an average condition between low and high and is assumed with the full range of uncertainty of both categories.
-
Low: The emergency management agency is not well-prepared to issue an effective message to the public.
-
Moderate: The emergency management agency is moderately well-prepared to issue an effective message to the public that motivates the population receiving the message to act.
-
High: The emergency management agency is well-prepared to issue a well-crafted and convincing message to the public that motivates the population receiving the message to act.
The public perception of the level of risk is generally a function of the individual or group’s distance from the hazard (e.g., dam or river). Other factors that can influence public perception is the frequency and severity of recent events and extremely effective and persistent public awareness campaigns.
The public perception of the level of risk categories are:
-
Unknown: This is an average condition between low and high and is assumed with the full range of uncertainty of both categories.
-
Low: The community at risk has a general perception that the warning and flood event will not affect them. When considering distance to the hazard location, this category could be used when the population is greater than 0.25 miles from the river or greater than 0.5 miles from the dam.
-
Moderate: The community at risk has a general perception that the warning and flood event could affect them. When considering distance to the hazard location, this category could be used when the population is approximately 0.25 miles from the river or approximately 0.5 miles from the dam.
-
High: The community at risk has a general perception that the warning and flood event will likely affect them. When considering distance to the hazard location, this category could be used when the population is less than 0.25 miles from the river or less than 0.5 miles from the dam.
Create New Protective Action Initiation
To create a new protective action initiation relationship:
- From the Protective Action Initiation tab (Figure), click the Add New button. The Name of New Protective Action Initiation dialog box (such as Figure) opens.
- In Name box, enter a name for the new protective action initiation relationship. Click OK, and the Name of New Protective Action Initiation dialog box closes and the new PAI relationship is created.
- From the Protective Action Initiation tab (Figure), select the desired distribution from the Distribution dropdown menu. The distribution options include:
- None: (percent warned).
- Log-Normal: mean (of log, μ), standard deviation (of log, σ).
- Normal: mean (μ), standard deviation (σ).
- PERT: minimum (a), most likely (c), maximum (b).
- Triangular: minimum (a), most likely (c), maximum (b).
- Uniform: (minimum, maximum).
- Define the daytime diffusion curve by entering the time (minutes) and percent initiated to take action in the PAI time-initiated table (Figure). Diffusion curve values can be entered by hand or copied from another application (e.g., Microsoft Excel®) and pasted into the table (i.e., entire table, individual cells, columns, rows). From the PAI table, right-click to open the shortcut menu (such as Figure). From the shortcut menu, the user can Add, Insert, and Delete Row(s); Select All; Copy or Copy with Headers; and Paste.
The PAI table can also be copied (with or without headers) into another application (e.g., Microsoft Excel®) for saving. Use Ctrl + A (or the Select All command from the shortcut menu), right-click, and select Copy w/ Headers. Then paste the data in the desired application to save.
Errors in the PAI diffusion curve are highlighted in red in the table and a tooltip displays a message describing the error (as in Figure). Right-click on a header row to open the shortcut menu (Figure) to sort the table in ascending or descending order, or clear the table sorting. - Click OK to save the new PAI diffusion curve and close the Warning And Protective Action Data Editor (Figure).
Edit Protective Action Initiation
To edit an existing PAI diffusion curve, select the desired protective action delay relationship from the Protective Action Delay dropdown menu (e.g., Perception: Unknown / Preparedness: Unknown in Figure). Either begin editing the values in the PAI table or select the desired distribution from the Distribution dropdown menu and define the PAI diffusion curve. Click OK to save edits and close the Warning And Protective Action Data Editor (Figure).
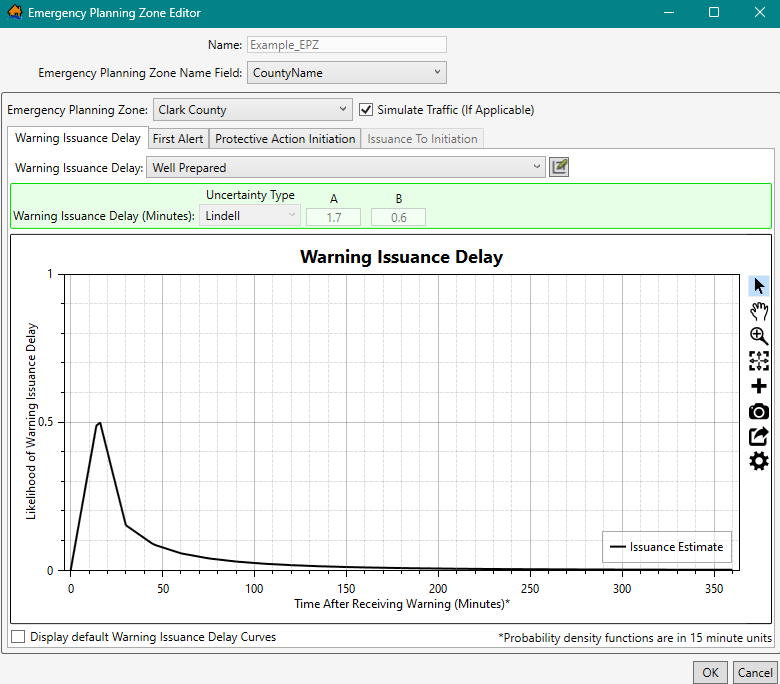
Emergency Planning Zone (EPZ) Editor
The Emergency Planning Zone Editor (Figure) allows the user to import an emergency planning zones (EPZ) dataset and enter information defining separate warning and evacuation parameters per EPZ. In most cases, separate emergency management agency areas within the study area are modeled as unique emergency planning zones since the warning issuance efficiency, message content, and public response can vary (Figure).
Users import the emergency planning zone dataset from a polygon shapefile where each polygon feature in the shapefile represents an emergency planning
zone. Multiple EPZ datasets can be imported and defined. The warning and evacuation parameters cannot be modified in the Emergency Planning
Zone Editor (Figure); however, selecting the Edit Data
 button opens the Warning
And Protective Action Data Editor (Figure), which allows users to edit and define warning and protective action
parameters.
button opens the Warning
And Protective Action Data Editor (Figure), which allows users to edit and define warning and protective action
parameters.
NOTE: the Emergency Planning Zone Editor (Figure) opens when editing imported EPZ datasets (refer to Edit an EPZ Dataset) but the Import Emergency Planning Zone editor (Figure) opens when importing a new EPZ dataset (refer to Create and Define an EPZ Dataset).
EPZ Editor Overview
The tabs on the Emergency Planning Zone Editor (Figure) represent the warning delay and the first alert and PAI
diffusion curves that need to be created for the emergency planning zones. The Emergency Planning Zone Editor
contains four tabs: Warning Issuance Delay, First Alert, Protective Action Initiation, and Issuance To Initiation. The first three tabs contain
the same buttons for editing the warning and evacuation parameters. The Edit
Data button opens the Warning And Protective Action
Data Editor (Figure). All four tabs contain the same general plotting tools (located on the right side of the plot window) for
customizing the plots (review Customizing Plots and Plotting Tools for more
information).
Create and Define an EPZ Dataset
In most cases, separate emergency management agency areas within the study area are modeled as unique emergency planning zones since the warning issuance efficiency, message content, and public response can vary.
Import EPZ from Polygon Shapefile
To create emergency planning zones from a point shapefile:
Import Options
From the LifeSim main window, from the Study tab, from the Study Tree, right-click on Emergency Planning Zones. From the shortcut menu, click Import EPZs From Shapefile (Figure). Another way from the LifeSim main window is from the Study menu, point to Emergency Planning Data, and click Import From Shapefile (Figure).
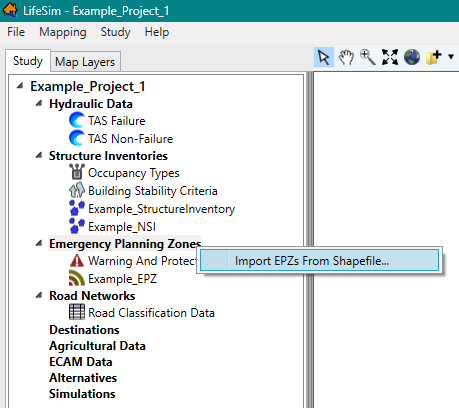
Figure: LifeSim Study Tree – Emergency Planning Zones – Import EPZs From Shapefile Shortcut Command 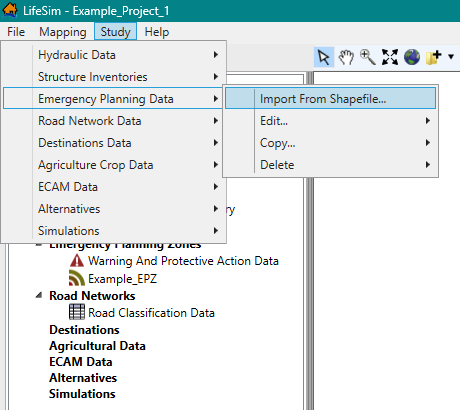
Figure: LifeSim Main Window – Study Menu – Emergency Planning Zones Sub-menu - Either way, the Import Emergency Planning Zones editor (Figure) opens. Enter a name for the emergency planning zone in the Name box.
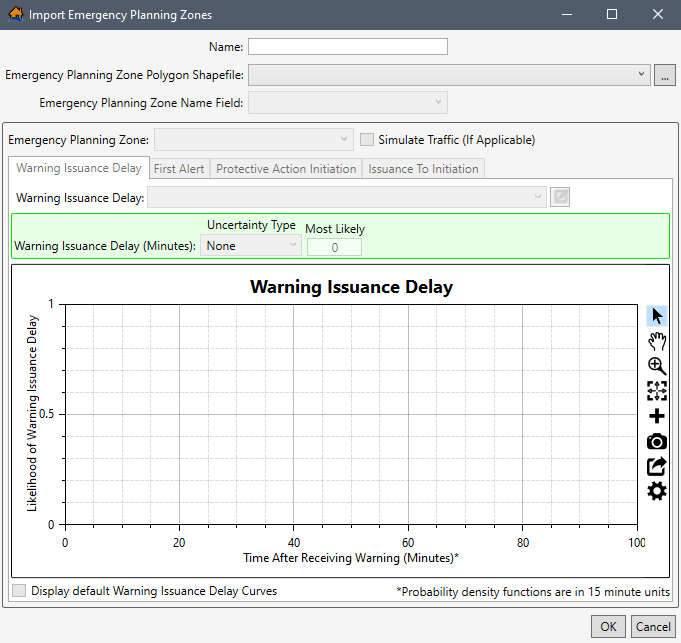
Figure: Import Emergency Planning Zone Dialog Box - To select the shapefile that contains information about the emergency planning zone, to the right of the Emergency Planning Zone Polygon Shapefile dropdown menu (Figure), click
 . An Open browser (Figure) opens. Navigate to the directory where the polygon shapefile is located. Select the correct polygon shapefile (e.g., *.shp) and click Open; the Open browser closes and the user will be returned to the Import Emergency Planning Zone dialog box (Figure). Alternatively, if the desired shapefile has already been imported as a map layer into the LifeSim study, then from the Emergency Planning Zone Polygon Shapefile dropdown menu (Figure), select the desired map layer.
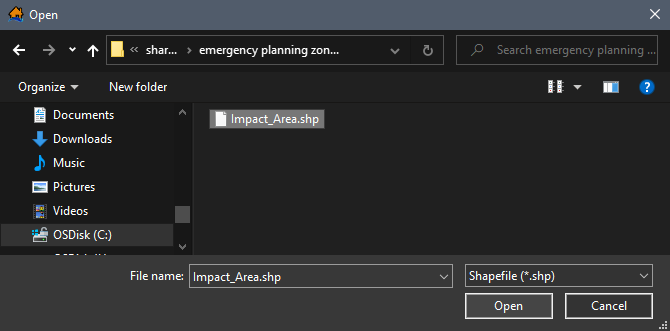
Figure: Open Browser Window – Select Polygon Shapefile Select EPZ Name Field
From the Emergency Planning Zone Name Field (Figure) dropdown menu, select the shapefile attribute that is representative of the unique emergency planning zone (e.g., CountyName in Figure). The list of items in the Emergency Planning Zone Name Field dropdown menu is generated from the selected emergency planning zone shapefile.
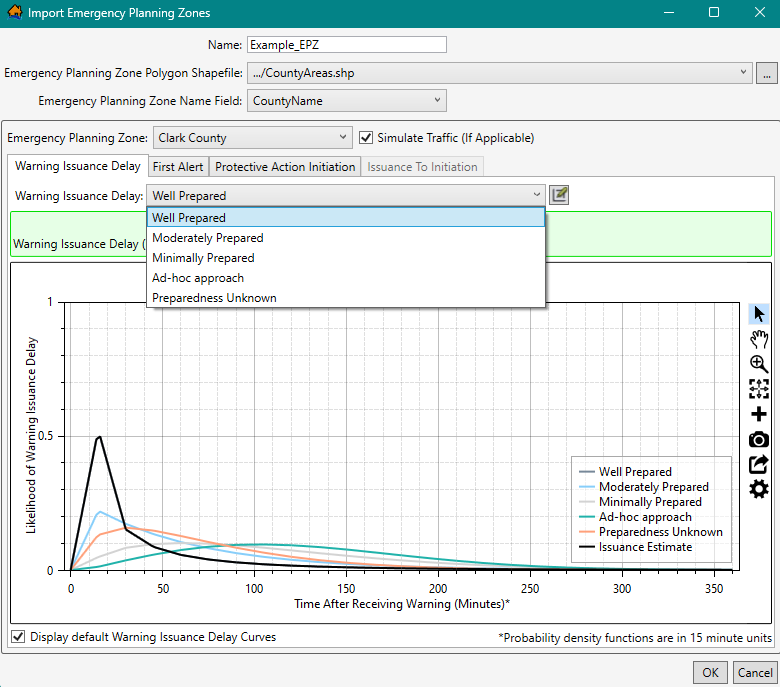
Figure: Import Emergency Planning Zones – Warning Issuance Delay Tab - The Emergency Planning Zone Name Field dropdown menu selection updates the Emergency Planning Zone dropdown menu (e.g., Clackamas County in Figure) to contain the names of all of the zones (polygons) in the selected shapefile. The user must define the warning and evacuation parameters to reflect the specific situation in each zone in the study area.
The following steps must be completed for every EPZ area in the Emergency Planning Zone dropdown menu.
By default, the Simulation Traffic (If Applicable) option is turned on (the checkbox
is checked) to simulate traffic in the selected EPZ. However, the traffic simulation process can be intensive and take a long time to compute. Therefore, if an area is unlikely to require simulating traffic along evacuation routes, for groups taking protective action, then turn off the Simulation Traffic (If Applicable) option by unchecking  the checkbox.
Define Warning Issuance Delay
From the Warning Issuance Delay tab (Figure), the user will provide parameters that define the amount of time it could take for emergency managers to issue a warning to the public. From the Warning Issuance Delay default list (Figure), select the appropriate warning issuance delay curve for the selected EPZ area (e.g., the warning issuance delay curve estimated for Clark County in Figure).
- The user can also edit and delete existing curves; and/or create, delete, and add user defined curves by clicking the Edit Data button to open the Warning And Protective Action Data Editor (Figure); refer to section Warning and Protective Action Data Editor for more information.
- To view all of the default warning issuance delay curves from the Import Emergency Planning Zones dialog box (Figure), check the checkbox to Display default Warning Issuance Delay Curves; all the default curves will display in the Warning Issuance Delay plot window (Figure).
Select First Alert Diffusion Curves
From the First Alert tab, the user will provide parameters that define the warning diffusion curves for daytime (from the Daytime First Alert tab) and night-time (from the Night-time First Alert tab) scenarios. First alert curves are separated into daytime and night-time scenarios because the speed at which a first alert can be received can vary significantly between daytime and night-time (Figure)
Figure: Import Emergency Planning Zones – First Alert Tab - Day vs Night Default Moderate Curve - From the First Alert Diffusion dropdown menu (e.g., Moderate selected in Figure), select the appropriate first alert diffusion curves; the selection sets the daytime and night-time curves for the selected EPZ area (e.g., for Clark County in Figure).
- The user can also edit and delete existing curves; and/or create, delete, and add user defined curves by clicking the Edit Data button to open the Warning And Protective Action Data Editor (Figure); refer to section Warning and Protective Action Data Editor for more information.
Set Protective Action Initiation Function
From the Protective Action Initiation tab, select the appropriate curve from the Protective Action Delay dropdown menu (Figure) to define the PAI response curve for the selected EPZ area (e.g., for Clark County in Figure).
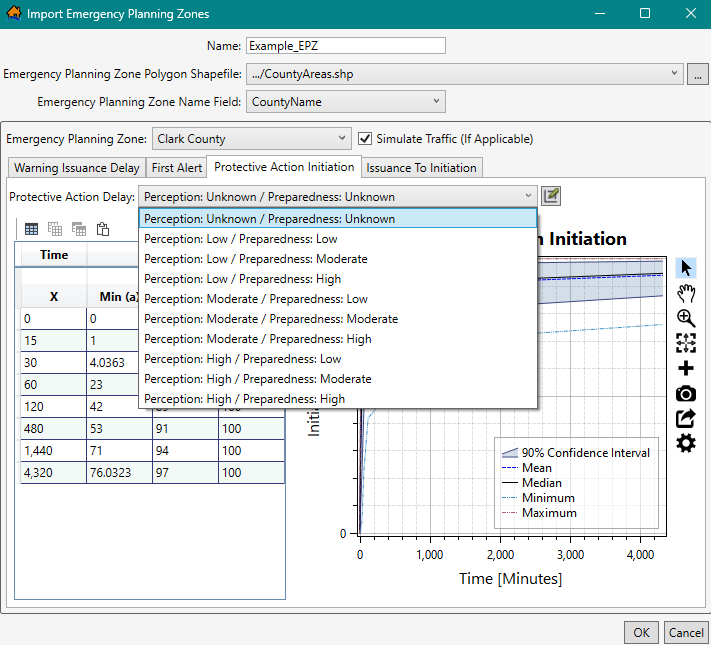
Figure: Import Emergency Planning Zones – Protective Action Initiation Tab – PAI Response Curves - The user can also edit and delete existing curves; and/or create, delete, and add user defined curves by clicking the Edit Data button to open the Warning And Protective Action Data Editor (Figure); refer to section Warning and Protective Action Data Editor for more information.
View the Combined Warning and Evacuation Curve
The Issuance To Initiation tab provides a visualization of the combined warning and mobilization function. It is the % of population that will take protective action over time once the warning is issued. It also provides a way for the user to display the combined uncertainty of the warning and protective action functions. The combined function is a concise way to present the evacuation response to warning issuance.
View the combined warning and evacuation curve for the selected EPZ area by selecting the Issuance To Initation tab (e.g., for Clark County in Figure).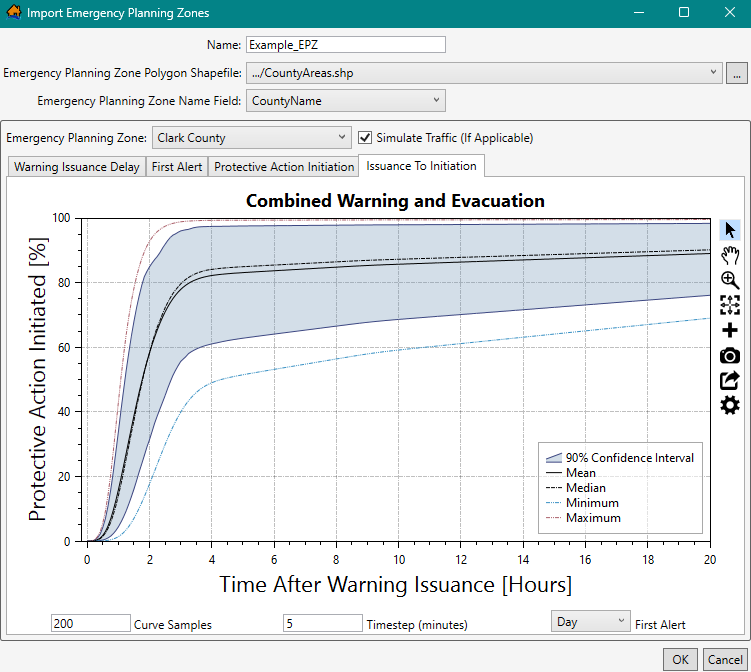
Figure: Import Emergency Planning Zones – Issuance To Initiation Tab - From the bottom of Issuance To Initation tab (Figure), modify the combined warning and evacuation plot by entering values for the Curve Samples, Timestep (minutes), and First Alert time. View the summary plot for the daytime or night-time scenarios by selecting Day or Night from the First Alert dropdown menu. Modifying the values does not impact the simulation -- only the combined warning and evacuation visualization is impacted.
Save the New EPZ Dataset
Continue to set the warning and protective action parameters for every emergency planning zone in the selected shapefile; and therefore, listed in the Emergency Planning Zone dropdown menu (e.g., Clark County in Figure).
- Once all of the correct information for the EPZ dataset has been entered (e.g., dataset Example_EPZ in Figure), click OK. The Import Emergency Planning Zones dialog box closes. From the LifeSim main window, from the Study Tree, under the Emergency Planning Zones folder, the name of the EPZ dataset will display (e.g., Example_EPZ).
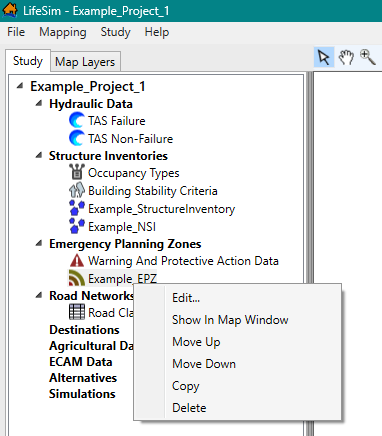
Edit an EPZ Dataset
Once an EPZ dataset has been created, the user can edit that EPZ dataset from the Emergency Planning Zone Editor (Figure). From the LifeSim main window, from the Study tab, from the Study Tree, from the Emergency Planning Zones folder, right-click on an EPZ dataset. From the shortcut menu (Figure), click Edit.
Another way is from the LifeSim main window, from the Study menu, point to Emergency Planning Data, point to Edit (Figure), and click an EPZ dataset.
Either way, the Emergency Planning Zone Editor (Figure) opens. Refer to section EPZ Editor for information on defining warning and evacuation parameters for a selected EPZ.
Display an EPZ Dataset
To display an EPZ dataset, from the LifeSim main window, from the Study tab, from the Study Tree, from the Emergency Planning Zones folder, right-click on an EPZ dataset. From the shortcut menu (Figure), click Show In Map Window. The selected EPZ dataset will display in the map window of the LifeSim main window.
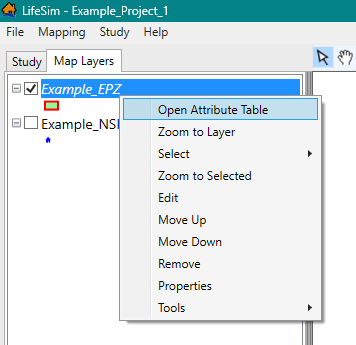
Map layer attributes can be accessed for each map layer and is provided in a table for the dataset referenced by the map layer. The EPZ dataset must be displayed in the map window before the attribute table can be accessed. To access a specific map layer's atribute table, from the Map Layers tab, right-click on a map layer of interest. From the shortcut menu, click Open Attribute Table (Figure).
The Map Layer Attributes dialog box opens; review Map Layer Attributes Dialog Box for more information. Editing of the map layer attributes is detailed in Editing Map Layer Features and Attributes.
Copy an EPZ Dataset
To copy an EPZ dataset from an existing dataset, from the LifeSim main window, from the Study tab, from the Study Tree, from the Emergency Planning Zones folder, right-click on an EPZ dataset. From the shortcut menu (Figure), click Copy.
Another way is from the LifeSim main window, from the Study menu, point to Emergency Planning Data, point to Copy (Figure), and click an EPZ dataset.
Either way, the Name of New Study Item dialog box (Figure) opens. Enter a new name in the Name box. Click OK. The Name of New Study Item dialog box closes and the copied EPZ dataset will display in the Study Tree under the Emergency Planning Zones folder.
Delete an EPZ Dataset
To delete an EPZ dataset from the LifeSim study and study directory files, from the LifeSim main window, from the Study tab, from the Study Tree, from the Emergency Planning Zones folder, right-click on an EPZ dataset. From the shortcut menu (Figure), click Delete.
Another way is from the LifeSim main window, from the Study menu, point to Emergency Planning Data, point to Delete (Figure), and click an EPZ dataset.
Either way, a Confirm Delete window (similar to Figure) opens asking for confirmation to delete the selected EPZ dataset. Click Yes, the Confirm Delete message window closes, and the selected EPZ dataset is deleted from the study and no longer displays in the Study Tree under the Emergency Planning Zones folder.