
Oroville
Oroville Dam in Oroville, California, United States.
🡇 Download ModelOverview
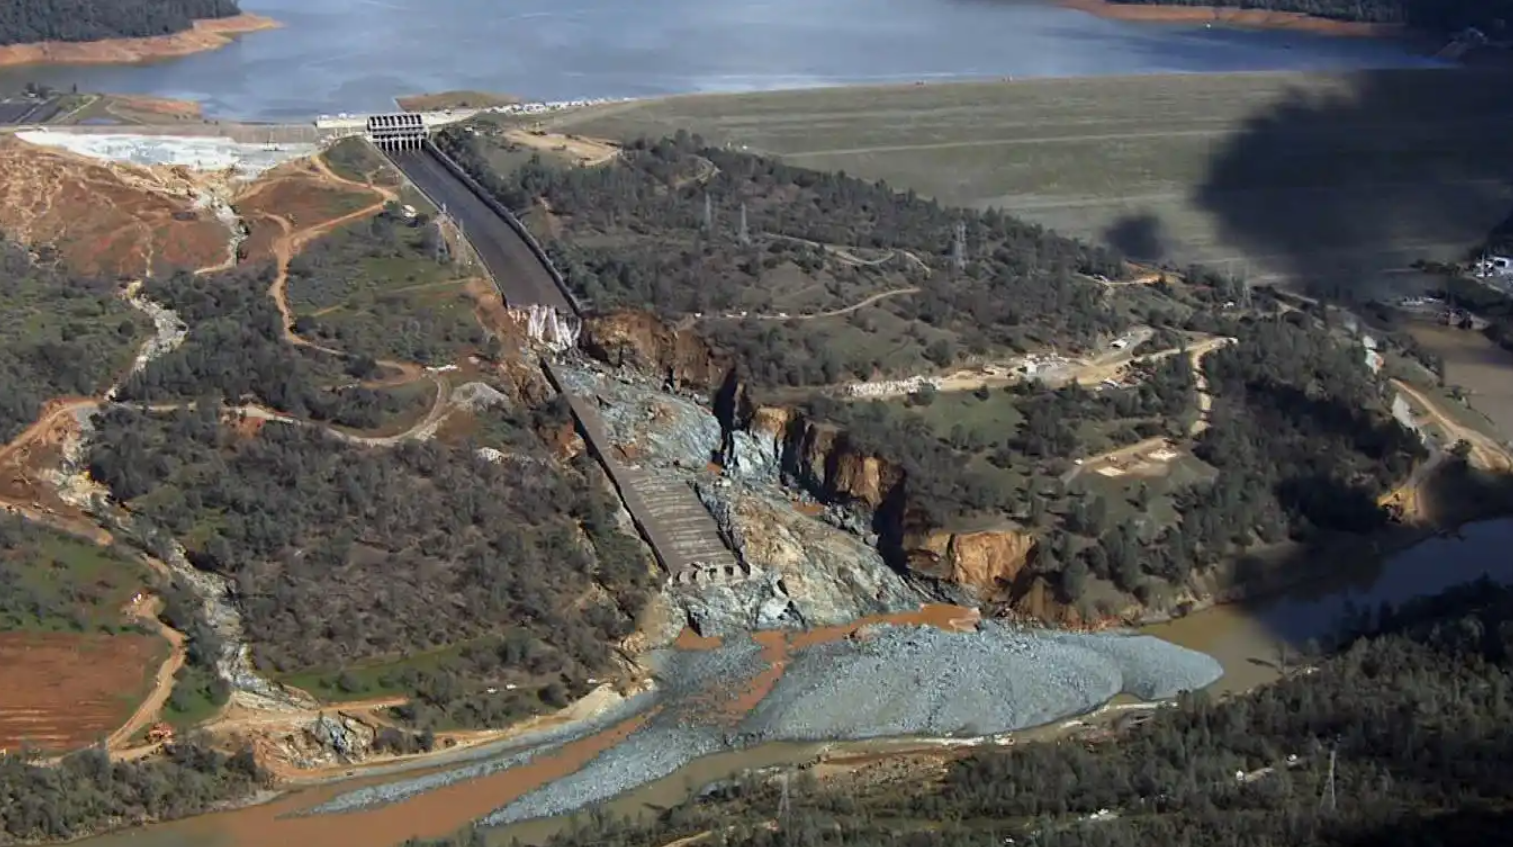
Oroville Dam, the tallest dam in the United States, is located approximately 65 miles north of Sacramento in the foothills of the Sierra Nevada mountains. The dam is part of the California State Water Project, supplying water throughout the state.
On February 6, 2017, record inflows from the Feather River resulted in controlled releases down the Oroville Dam service spillway. Shortly after releases began, a strange flow pattern developed, resulting in the closure of the service spillway gates for inspection. Upon inspection, it was revealed that a large area of the service spillway had eroded, initiating additional investigations. Inflows were significantly higher than forecasted. On February 9, 2017, the service spillway was re-activated. By February 11, 2017, the reservoir had reached the emergency spillway crest.
In the afternoon of February 12, 2017, the hillside began to erode. Around 3:50 PM, local Emergency Management personnel decided to evacuate downstream communities, and inundation mapping for total dam failure was used to make a conservative estimate regarding what areas should be evacuated in case of emergency spillway failure.
Evacuation of over 180,000 people commenced. Fortunately, Oroville Dam did not fail, and there were zero fatalities.
Data
The following provides a short description of the data sources used for validation.
The data for this validation effort was collected using internet exploration, community windshield survey, and conversations with key informants detailed in Sorensen & Mileti (2018) [?], unless otherwise noted.
Hydraulics
Hydraulic modeling for this Oroville Dam validation effort has not been completed. For purposes of simulating evacuation, dummy depth grids with no depths were added to the LifeSim model. Once hydraulic data is available, it can be easily uploaded in the model and used with the existing alternatives.
Structure Inventory
The structure inventory is a subset of the structure inventory used for the Oroville Dam Complex Consequences Analysis (DWR, 2020) [?]. Stability criteria were assigned to each structure based on construction type.
Road Network
The road network was imported and modified from Open Street Map, available under Open Database License [?].
Destinations
Evacuation destinations were created based on survey data collected post-event where respondents were asked about their evacuation destination.
Emergency Planning Zones
Emergency Planning Zones (EPZs) were created based on the three counties that were evacuated during the 2017 event: Yuba, Sutter, and Butte Counties. Warning and evacuation parameters Warning Issuance Delay, First Alert, and Protective Action Initiation were defined for each county using the data collected post-event.
Alternative
The model alternative and associated Imminent Hazard ID Times and Hazard Communication Delays per EPZ are based on destinations reported by respondents in the post-event survey.
Additional model evacuation results may be available upon request based on:
- Destinations recommended on the Butte County website posted after the 2017 event.
- Evacuation centers and assembly points left out of the public model alternative because LifeSim does not currently have a way to account for capacity limits or specific transportation modes offered at these centers. Additionally, since LifeSim’s evacuation logic is such that evacuees will go to the destination with the shortest travel time, having these centers in the model encourages vehicle traffic to evacuate to destinations within the inundated area. This is not ideal due to the inability to model the capacity limits and group evacuation from these centers. These centers are primarily available to demonstrate how they may be utilized in an evacuation.
Modeling Conclusion
Alternative results are available as a sensitivity analysis to depict how destination selection impacts overall evacuation effectiveness.
Model Version
The public model was updated in 2025 to LifeSim version 2.1.5 and produced negligible changes from the original model results.