
Teton
Teton Dam in Madison County, Idaho, United States.
🡇 Download ModelOverview
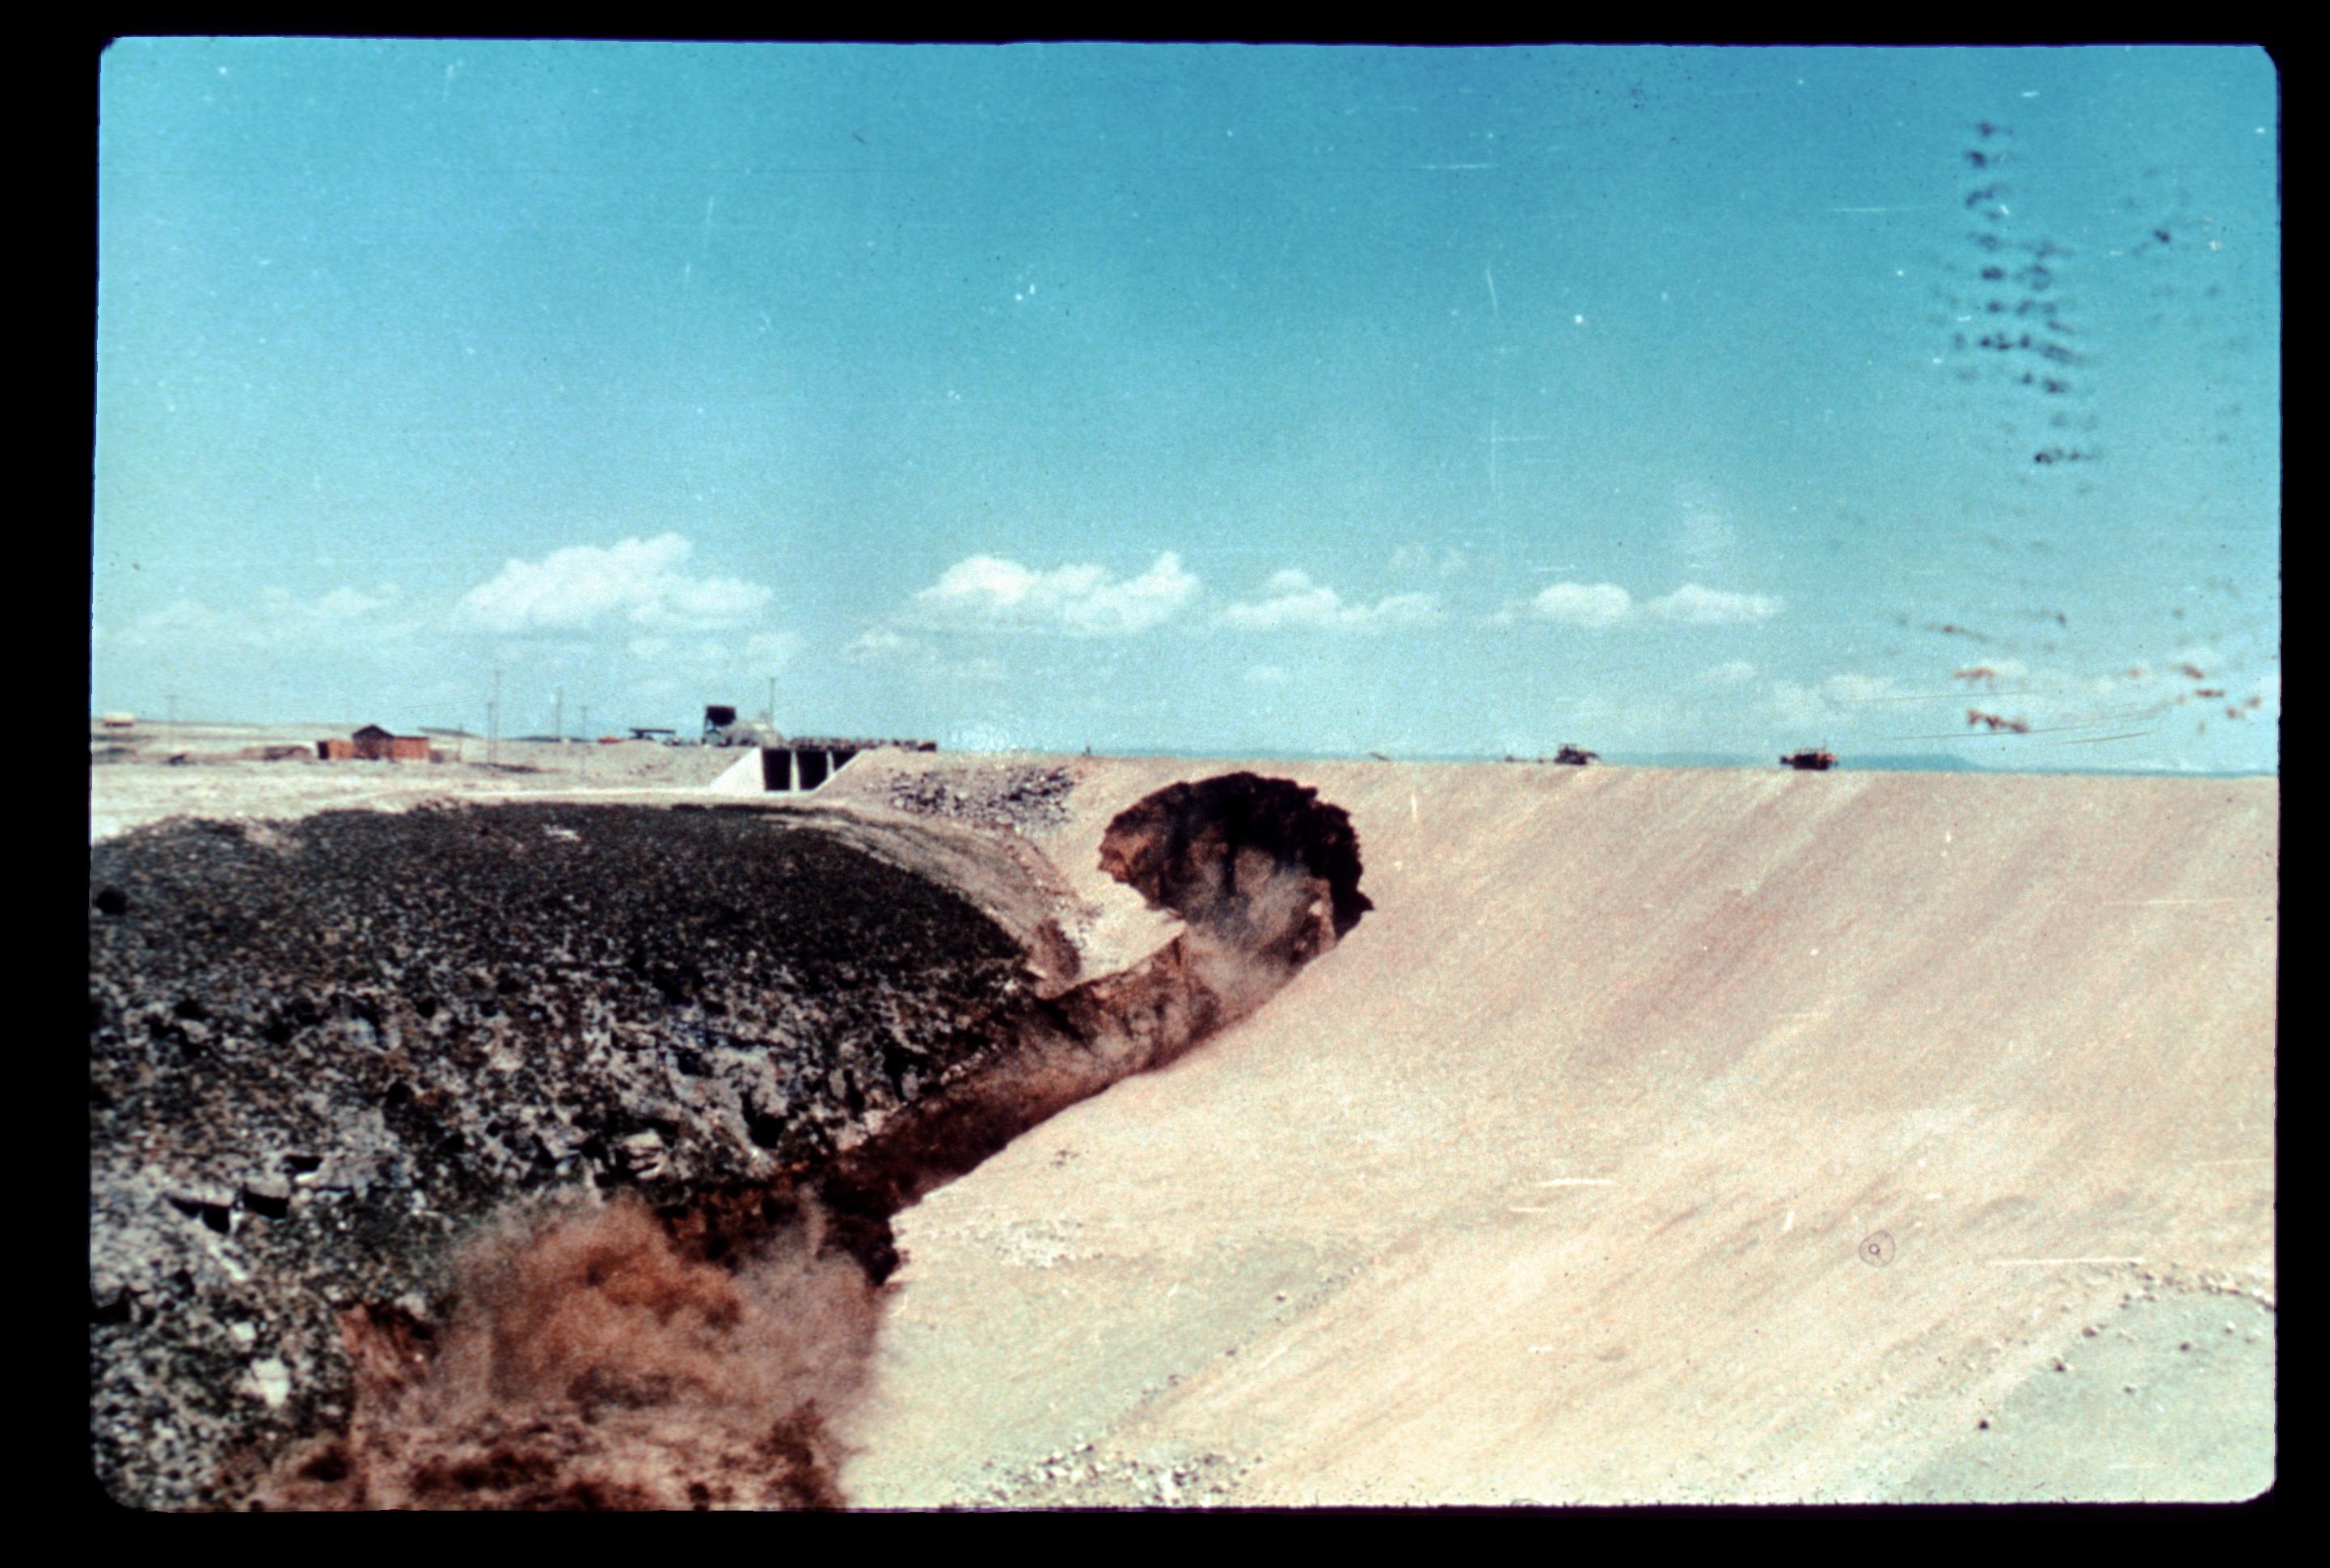
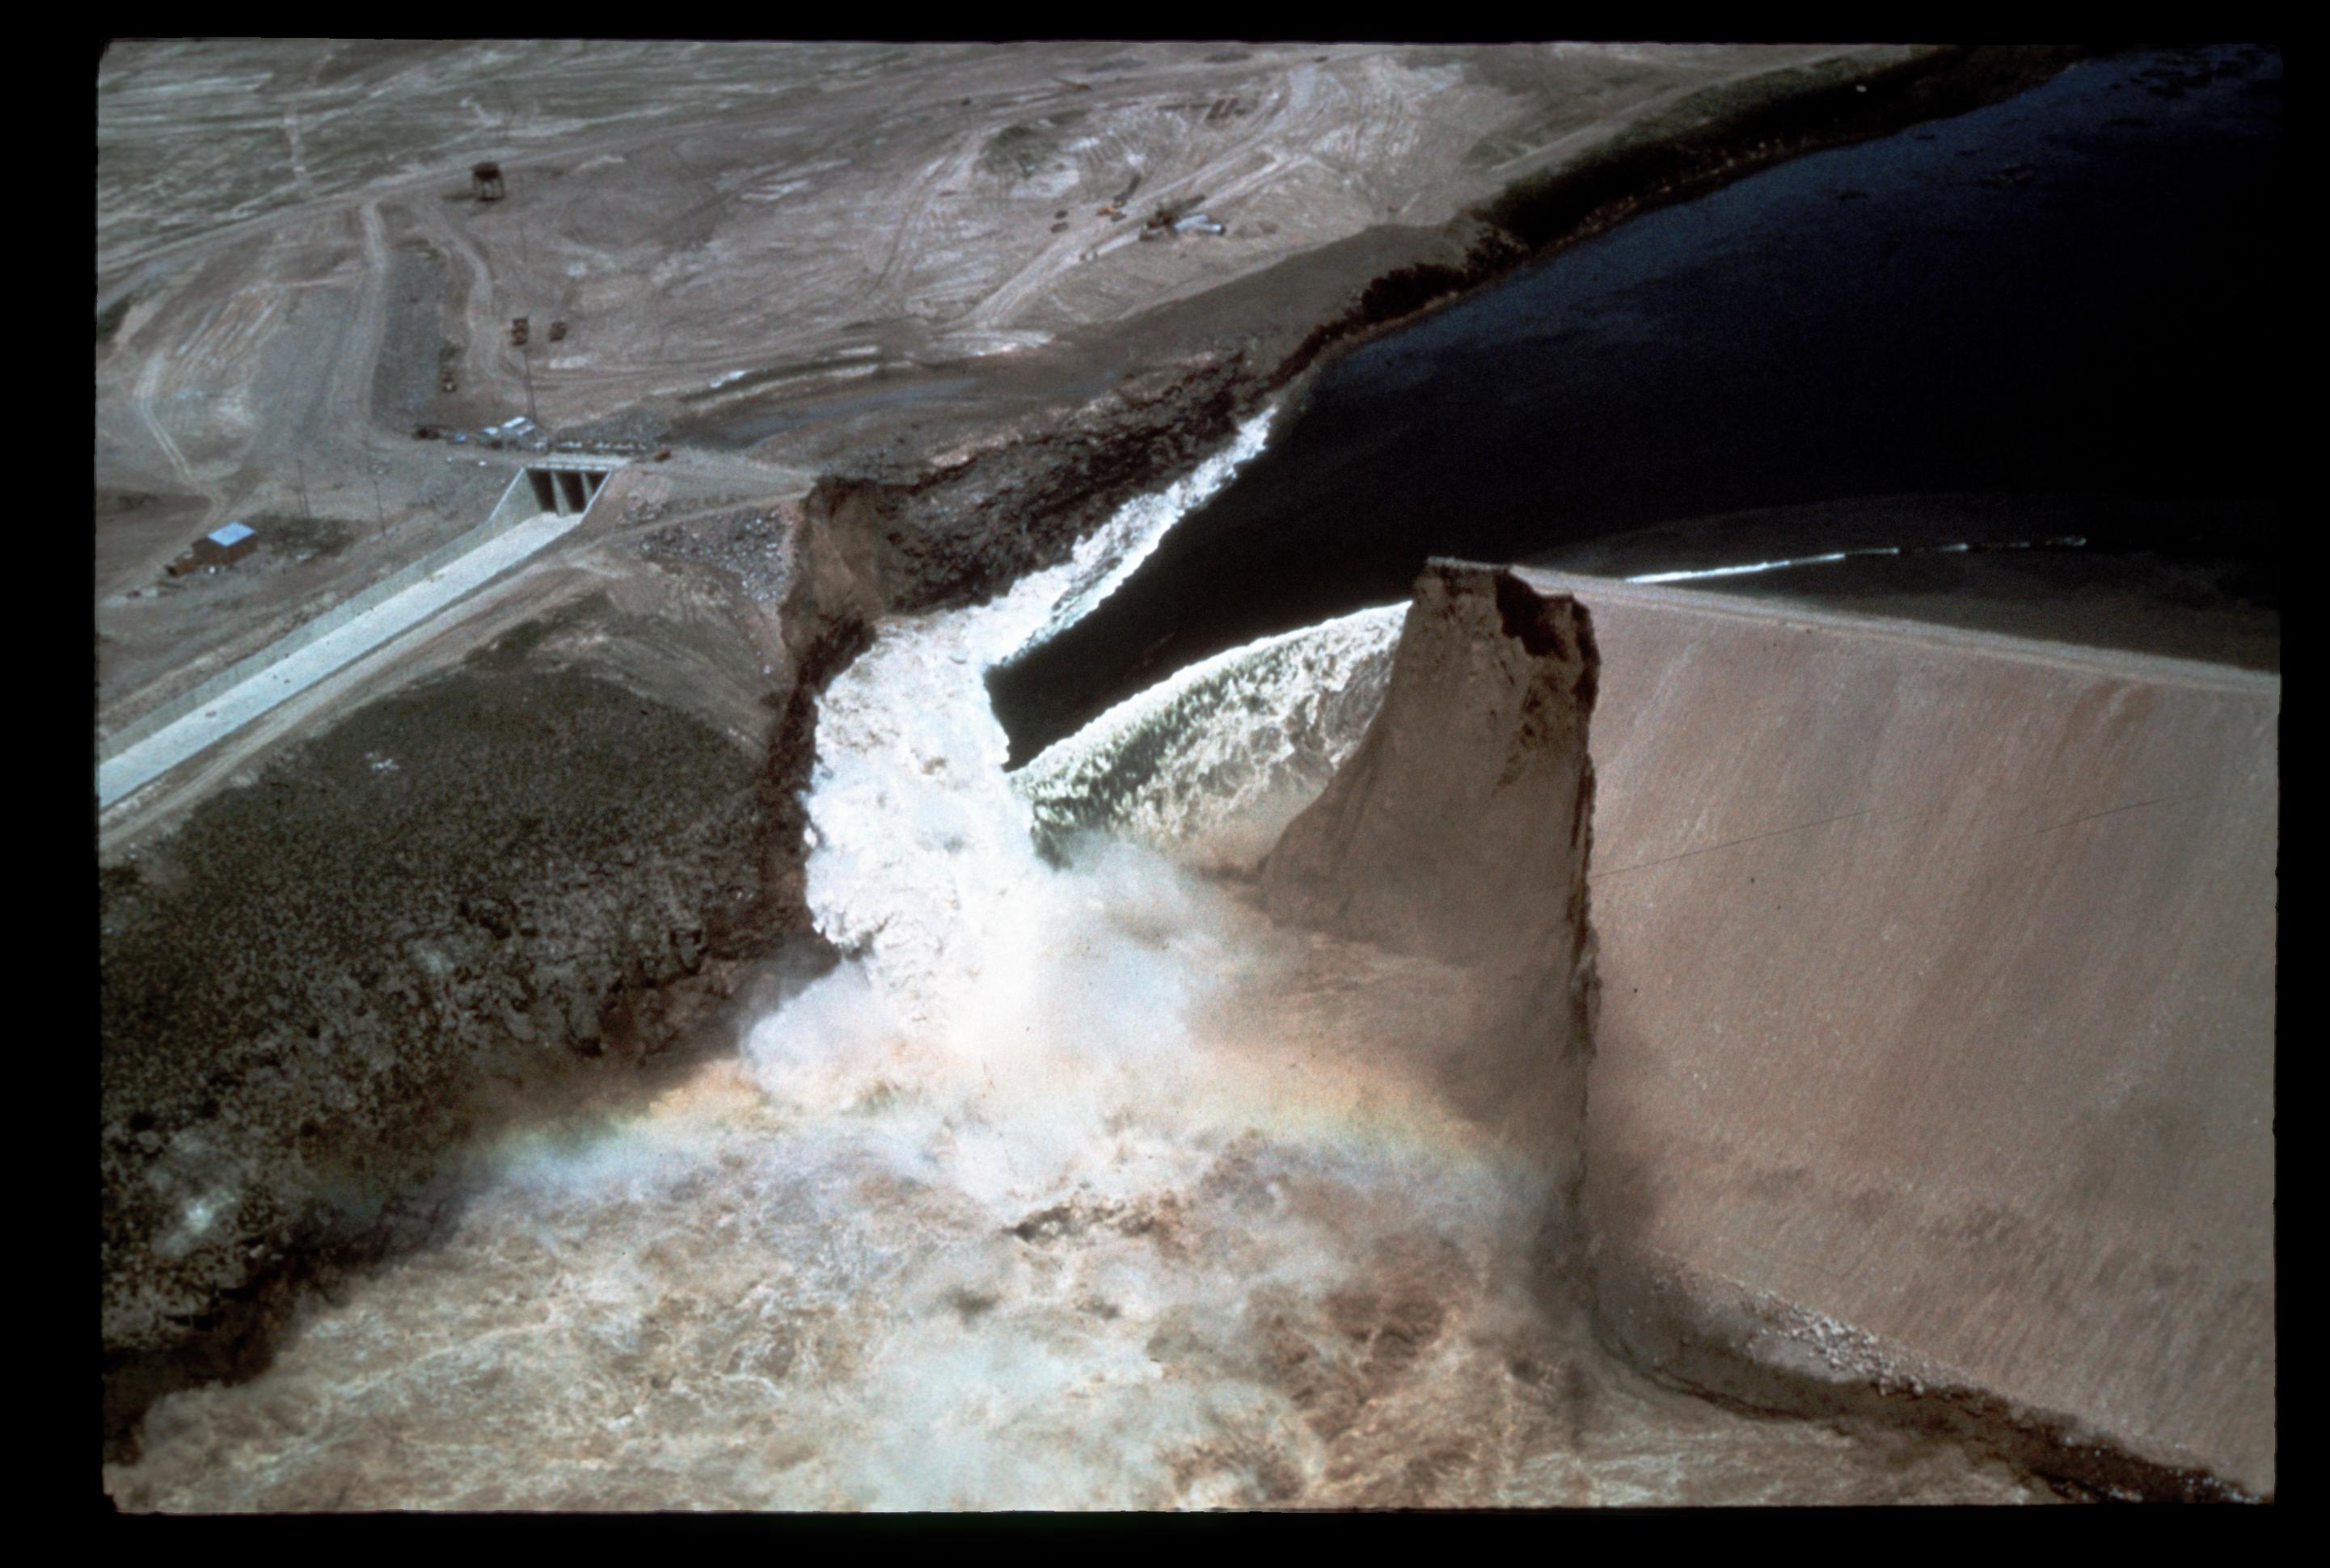
On Saturday, June 5, 1976, at 11:57 AM, on a bright and sunny day, Teton Dam failed during its first filling. It took only five hours from the first sign of turbid seepage until failure. Measured in terms of either dam height or volume of water released, the failure was the worst in U.S. history. More than 180 square miles were inundated, 771 homes were destroyed, 3,002 homes were damaged, 16,650 livestock were lost, and 11 people lost their lives directly or indirectly from the flood (USGS, 1978) [?]. The town of Wilford, ID was destroyed. The town of Sugar City, ID was devastated by a wall of water 15 feet high and moving 10 to 15 miles an hour. Eventually, the flood spread out eight miles wide as it approached and flooded Rexburg, ID. Estimated economic damages ranged from hundreds of millions up to 2 billion dollars.
The dam failure became the most significant Bureau of Reclamation project failure in the agency’s history. It resulted in an immediate investigation by Reclamation, Congress, two independent review panels, and others. The dam failure served as the catalyst for national dam safety legislation and the creation of a federal dam safety program, including Reclamation’s Dam Safety program.
Data
Data was collected by HDR, Inc. (HDR) from many sources including photos, books, articles, and witness testimony to support the calibration of the hydraulic model (HDR, 2022) [?]. The most relevant data were collected, organized, and provided to the U.S. Army Corps of Engineers (USACE). More reliable, detailed or factual accounts were given priority. Agreement between multiple sources of information was sought, such as a photo and a testimony.
The complete Teton validation study analysis is documented in McMaster (2022) [?].
The following provides a short description of the data sources used for validation.
Hydraulics
HDR developed a 2-dimensional (2D) unsteady hydraulic model of the Teton Dam failure based on the best available topography data, collected historic data, and previous studies. Hydrologic Engineering Center's River Analysis System (HEC-RAS) version 6.2 was utilized. Breach parameters were developed based on analysis of photos, drawings, and previous studies. The model was used to simulate the Teton Dam breach and the flood inundation along Teton, Henry’s Fork, and Snake Rivers from Teton Dam to USGS Stream Gage 13069500 downstream from Blackfoot, ID. The 2D modeling results were then provided to USACE as input for consequence analysis using LifeSim.
The terrain data was acquired from Idaho LiDAR Consortium. It is a combination of four bare earth DEMs with resolutions ranging from 2 to 33 feet. All elevation data is in NAVD 88 feet vertical datum. Where available, channel profiles from the latest Federal Emergency Management Agency (FEMA) Flood Insurance Studies were utilized.
Structure Inventory
Population estimates from the U.S. Census Bureau (1970; 1971) [?] [?], Federal Reserve Bank of St. Louis (2021) [?], and the book The Teton Dam Disaster (McDonald, 2006) [?] were used in the population calibration of the USACE base layer National Structure Inventory (NSI) version 2019 [?]. Structure counts and locations were sourced from a combination of estimates and aerial imagery from the aforementioned sources.
The inventory was manually calibrated in Esri ArcGIS Pro to adjust structure placement, physical characteristics, monetary values for damage estimates, and population estimates to best represent the inundated area in 1976. Most structures were manually moved based on the same 1976 USGS atlases used in the hydraulic model calibration (HDR, 2022) [?]. Others were calibrated using aerial imagery. This effort resulted in 2,399 inundated structures between Teton Dam and American Falls Reservoir, referred to as Structure Inventory 1 (SI1). A further calibrated structure inventory (SI2) was created to represent the reported number of inundated homes – 3,773 – according to the Idaho Statesman.
Road Network
A road network used to simulate road evacuation was developed from Open Street Map [?] in June 2022. Like the initial structure inventory, the network was manually calibrated using the 1976 USGS Hydrologic Investigations Atlases (USGS, 1976) [?] and other aerial imagery.
Destinations
“Destination features represent point locations on roads, generally outside of the inundation extents, where evacuating groups travel to and are assumed safe once they arrive… Evacuating drivers choose a destination based on the shortest travel time from their current location to a destination. If their path becomes obstructed by either flood water or traffic congestion, drivers alter their path and destination as necessary” (USACE RMC 2021).
Emergency Planning Zones
All Emergency Planning Zones (EPZs) in the case of the Teton Dam LifeSim validation effort coincide with county and city boundaries.
Documentation estimates 100 percent evacuation rates in the cities of Rexburg, Roberts, and Firth. These three, separated EPZs were set at zero Warning Issuance Delay, 100% First Alert diffusion rate, and 99% Protective Action Initiation (PAI) (given that a 100% evacuation rate is a difficult assumption to make).
For best-estimate runs of the remaining EPZs, custom First Alert and PAI curves were created to mobilize the appropriate PAR following hazard identification. A conservative, moderate, and generous curve were created for the two parameters. The moderate curves were meant to achieve around 90% mobilized by the time water reaches Wilford, ID. The custom curves were used to validate the software. These custom curves are compared against the preset LifeSim “well-prepared” Warning Issuance Delay, “fast” First Alert, and “Preparedness/Perception: High/High” PAI.
Alternative
There was assumed to be zero Hazard Communication Delay in the model. Consequently, the model warning goes out when the hazard is identified based on sources of sheriff phone call(s), radio stations, and word of mouth.
When parameters were customized to best match reality, whether through custom First Alert and PAI curves or forced mobilization rates, fatality rates were shown to be highly accurate. For First Alert-PAI selection, Moderate-Moderate, Moderate-Generous, and Moderate-Generous were best able to capture the targeted life loss of two direct fatalities (only two of the eleven individuals who lost their lives after the breach were naturally in the path of the flood waters). Model results also aligned with observed outcomes in that potential life loss was concentrated in Fremont and Madison Counties, with Fremont County most often driving results.
Modeling Conclusion
The evacuation following the breach of Teton Dam was seemingly as close to a best-case scenario as possible regarding an event so potentially catastrophic.
Areas like Rexburg and Roberts report full evacuation (McDonald, 2006) [?] due to the reporting of Don Ellis, door-to-door warning by authorities (both state and church), and religiously homogeneous, tightly knit, and trusting communities. Additionally, the breach occurred approximately five hours after turbid leakage was first noted at 7:00 AM. There were no personnel on site between midnight and 7:00 AM and moving the event timeline forward ever so slightly could have resulted in much worse outcomes. Furthermore, the breach occurred on a sunny Saturday morning. Many were away in St. Anthony (outside of the inundated area), with their families, or at the dam site for recreational purposes. Many at home tuned in to the local news and radio stations, hence the significance of Don Ellis’ timely reporting. Last, evacuation for many downstream was a result of walking just outside of the inundated area where the flood wave could be watched only a few city-blocks away (see Figure).

Considering the above factors, LifeSim performed well when input parameters were adjusted to reflect reality. Fatality rates proved accurate when warning and mobilization parameters and stability criteria were calibrated.
However, the preset First Alert and PAI parameters were mostly unable to capture the unprecedented mobilization of the downstream population. Both the quickness of evacuation and maximum mobilization rate of the preset parameters fell below the observed outcomes. Further investigation is warranted regarding best-case sampling of the existing preset curves.
All model results aligned with observed outcomes in that potential life loss was concentrated in Fremont and Madison Counties, with Fremont County most often driving results. Simulating road evacuation led to minimal life loss on roads. No life loss on roads was observed.
Model Version
The original LifeSim model was developed in 2022 using LifeSim version 2.0. The public model was updated in 2025 to LifeSim version 2.1.5 and produced negligible changes from the original documented results.