
Hurricane Katrina - New Orleans East Bowl
New Orleans Levee System during Hurricane Katrina in New Orleans (East Bowl only), Louisiana, United States.
🡇 Download ModelOverview
Hurricane Katrina (Katrina) formed as a tropical depression over the southeastern Bahamas on August 23, 2005. Katrina intensified after making landfall in southern Florida and became a Category 5 with peak winds of 175 mph; it was one of the most devastating natural disasters in United States history (Medlin et al., 2005) [?].
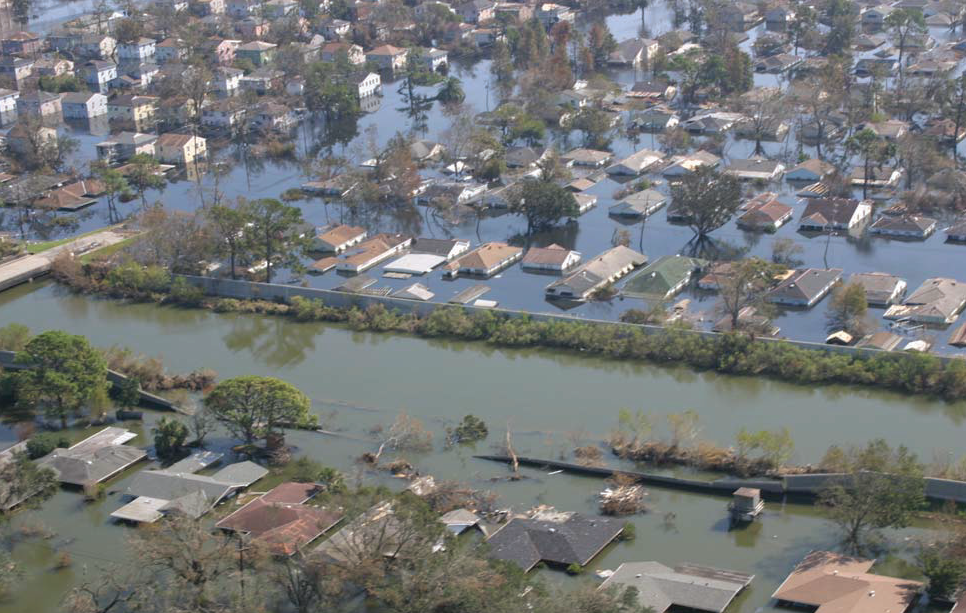
Katrina had weakened to a Category 3 when it made landfall in New Orleans, Louisiana (NOLA) the morning of August 29, 2005. Life loss and property damage were exacerbated in NOLA due to the levee failures across the city; “The majority… of the flooding and half of the economic losses can be attributed to water flowing through breaches in floodwalls and levees” (USACE, 2006) [?]. Primarily overtopping and subsequent erosion, 50 levees and floodwalls in NOLA failed during this catastrophic event. Approximately 80% of the city was flooded – causing over 1,400 NOLA fatalities and hundreds of thousands displaced (NYT, 2015) [?].
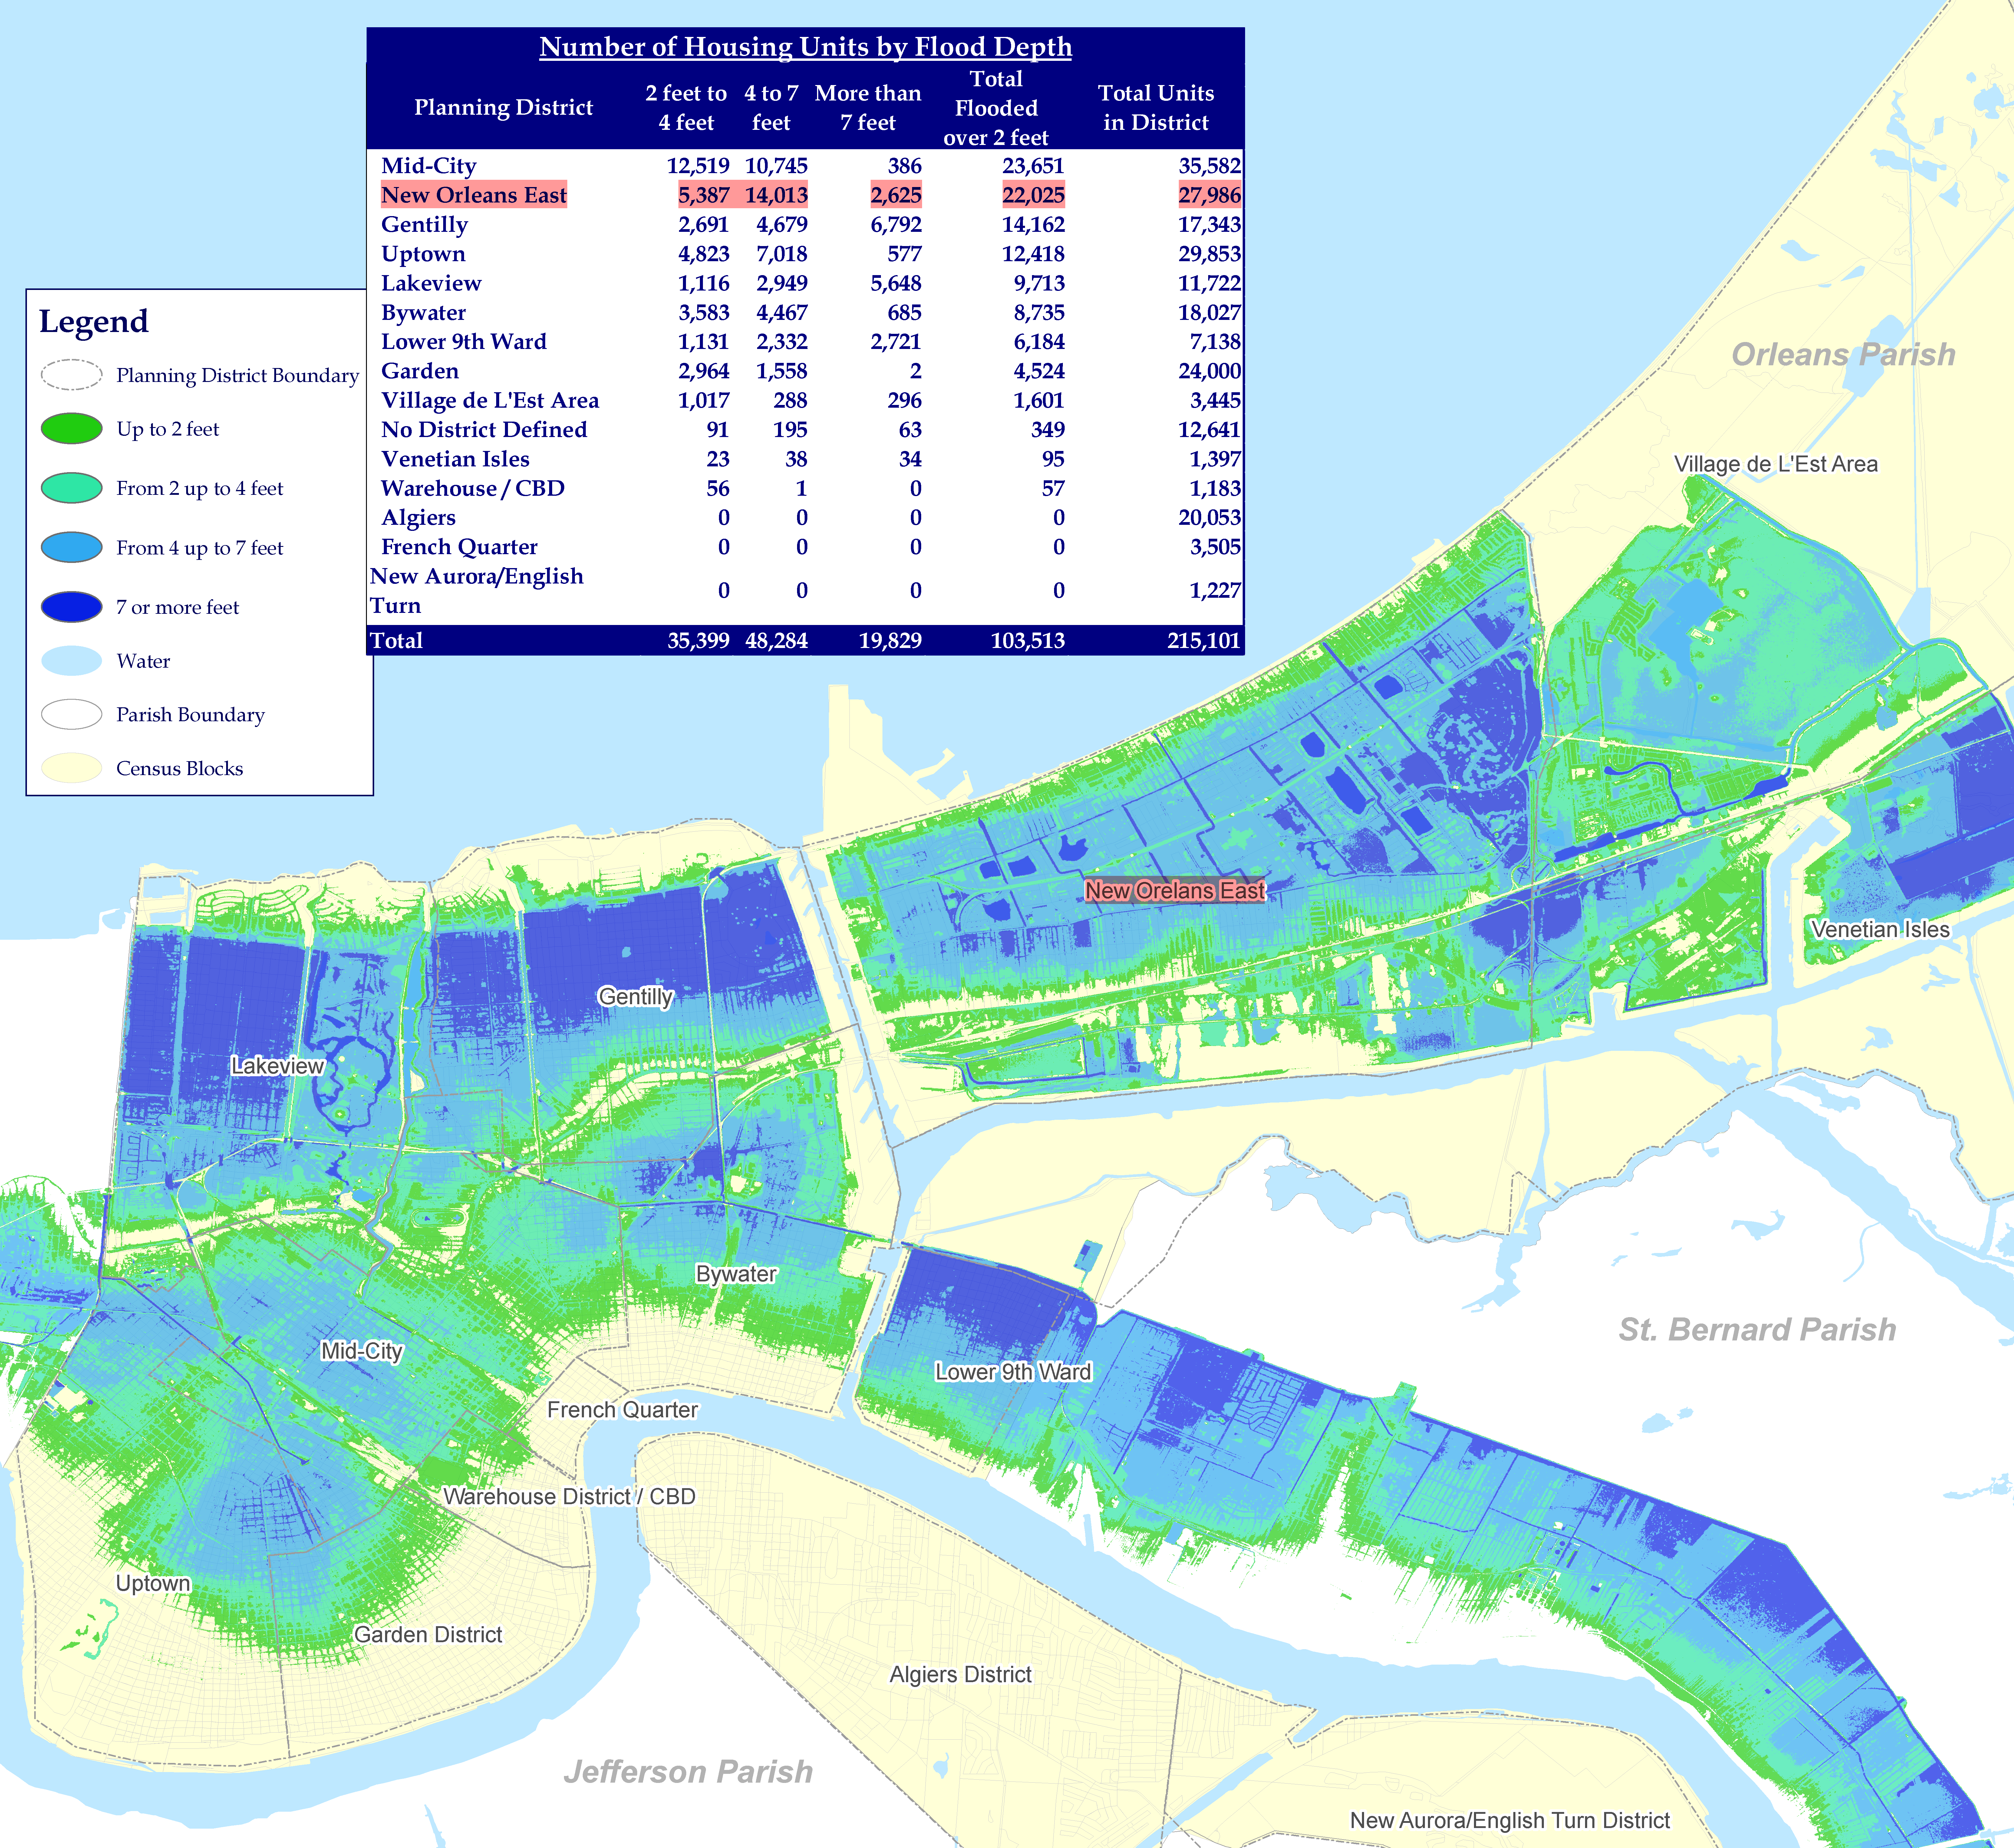
This validation data set focuses on NOLA East Bowl (highlighted red in Figure). According to Figure, of the 27,986 housing units in New Orleans East, 79% were flooded, and 9.4% was over seven feet of inundation. NOLA East Bowl is comprised of sub-divisions, large business and manufacturing areas, and a wildlife refuge. It had an estimated population of 96,400 people and average income of $41,997 in August 2005 (NYT, 2015) [?]. Of the NOLA East Bowl inhabitants, 9,620 were classified as exposed – meaning they were in the inundation area when the levees failed (Jonkman et al., 2009) [?].
Reported flood fatalities in NOLA East Bowl totaled 54 (Boyd, 2011) [?].
Data
The following provides a short description of the data sources used for validation.
Hydraulics
A calibrated HEC-RAS hydraulic model was sourced from the 2006 U.S. Army Corps of Engineers (USACE) Performance Evaluation of the New Orleans and Southeast Louisiana Hurricane Protection System Interagency Performance Evaluation Task Force (IPET) study.
"An intense performance evaluation of the New Orleans and Southeast Louisiana Hurricane Protection System during Katrina. It was conducted by the [IPET], a distinguished group of government, academic, and private sector scientists and engineers who dedicated themselves to this task from shortly after Katrina struck through the start of the next hurricane season. Created by the Chief of Engineers, [USACE] and peer reviewed literally on a weekly basis by an equally distinguished external review panel of the American Society of Civil Engineers, the group applied some of the most sophisticated capabilities available in civil engineering to understand what happened during Katrina and why. Their purpose was not just new knowledge, but application of that knowledge to the repair and reconstitution of protection in New Orleans as well as improvement to engineering practice and policies" (USACE, 2006) [?].
Structure Inventory
The structure inventory originated from 2015 parcel data, distributed 2004 population data, and manually-calibrated missing structures. Pre-Katrina aerial imagery was utilized for missing structures, and population inputs are reflective of the NOLA East Bowl pre-Katrina. The 2015 parcel dataset was obtained from the City of New Orleans and calibrated to the NOLA East Bowl breach event.
Comprehensive study data available in Loss of Life Estimation in Flood Risk Assessment, Theory and Applications, authored by Jonkman, S. of Delft University, was used to validate human fatality rates and population at risk (PAR) (Jonkman, 2007) [?].
Road Network
Traffic evacuations were not simulated. Therefore, a road network was not configured.
Destinations
Traffic evacuations were not simulated. Therefore, destinations were not configured.
Emergency Planning Zones
The Emergency Planning Zone (EPZ) is set to one area that covers the entirety of NOLA East Bowl.
-
Zero Warning Issuance Delay was implemented in the model due to the long warning time.
-
The warning diffusion (First Alert) curve was developed for Katrina based on research by Sorensen and Mileti (2018) [?]. Note that warning is distributed to 100% of PAR after less than five hours.
-
The Protective Action Initiation (PAI) curve reflected 80-90% (mean 85%) of PAR safely evacuating following the hurricane evacuation order, developed based on Jonkman (2009) research and findings [?]. Uniform uncertainty distribution was implemented.
Alternative
The evacuation of southeast Louisiana had begun approximately two days before Katrina's landfall (Boyd, 2010) [?]. The mayor of NOLA issued the official evacuation order of NOLA at 9:25 AM on August 28, 2005 (CNN, 2005) [?], approximately one day before landfall. The Imminent Hazard Identification is set to -24 hours with zero Hazard Communication Delay due to the long warning time.
Model Version
The original LifeSim model was developed in 2016-2017 using LifeSim version 1.0. The public model was updated in 2025 to LifeSim version 2.1.5 and produced negligible changes from the documented results.