Blanket Theory Case 2
Case 2 has an impervious top stratum on both the riverside and landside of the levee. The pervious substratum is divided into three zones to apply the method of fragments as shown in Figure.
Method of Analysis
The method of analysis is the same as in Case 1.
Levee Geometry
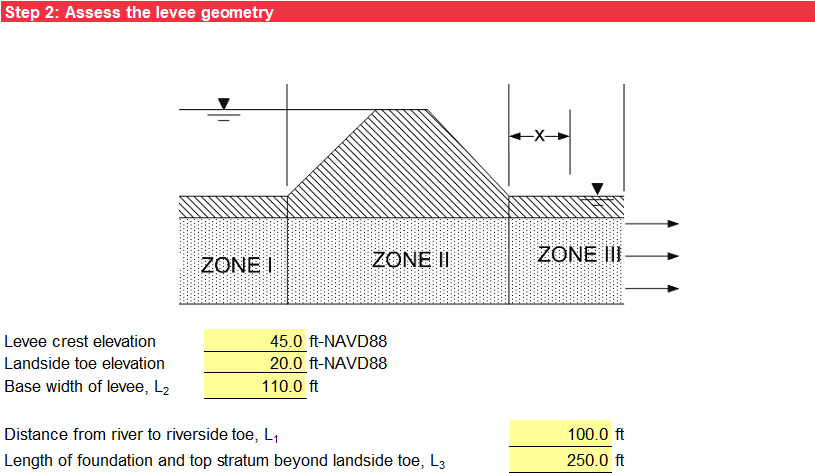
Step 2 characterizes the levee geometry. The input includes the levee crest elevation, landside toe elevation, distance from the riverside levee toe to the river (L1), base width of the levee (L2), and length of the foundation and top stratum beyond the landside levee toe (L3), as illustrated in Figure.
Pervious Substratum Characterization
The pervious stratum characterization is the same as in Case 1.
Landside Blanket (Top Stratum) Characterization
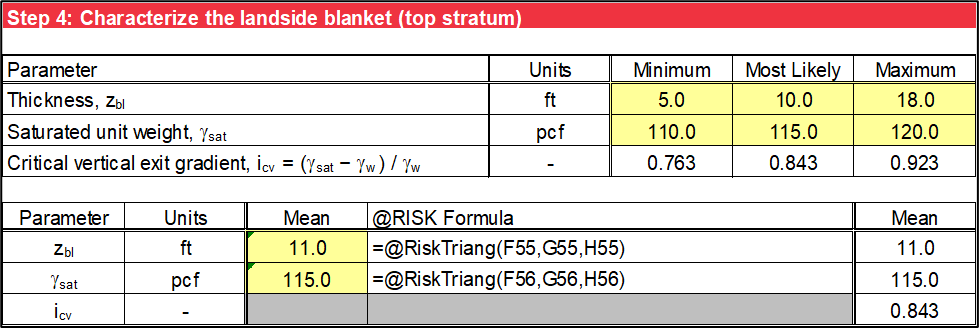
Step 4 characterizes the landside (top stratum). The selections in step 1 affect the input for step 4, and cells that do not apply have a gray background. These cells are not used in subsequent calculations even if data is present. The input includes thickness (zbl) and saturated unit weight (γsat) of the landside blanket. For deterministic analysis, input only the most likely values. The mean values used for subsequent calculations are the most likely (or mode) values.
The critical vertical seepage exit gradient for heave/blowout (icv), as defined in Terzaghi, Peck, and Mesri (1996), is calculated using Equation.
where:
γ' = submerged unit weight of the landside blanket
γsat = saturated unit weight of the landside blanket
γw = unit weight of water
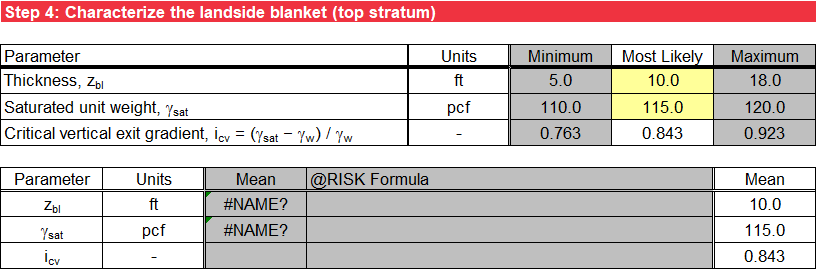
Figure illustrates the deterministic input.
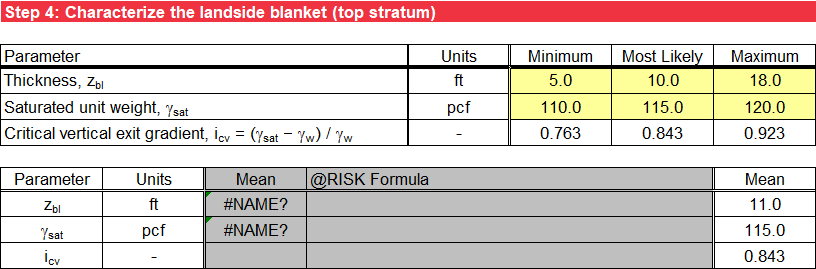
For probabilistic analysis without using @RISK, input the minimum and maximum values in addition to the most likely value, and triangular distributions represent the random variables. The mean values used in subsequent calculations are the average of the minimum, most likely, and maximum values. The triangular distribution for icv is calculated using the minimum, most likely, and maximum values for γsat. Since icv is a function of the random variable γsat, it is correlated with γsat, and is also a random variable. Figure is an example of the probabilistic input without using @RISK.
For probabilistic analysis using @RISK, input the minimum, most likely, and maximum values, and use an @RISK formula for a triangular distribution in the third column as a default. Alternatively, input a valid @RISK distribution in lieu of this default formula, and the user-specified input displays in the fourth column. The mean values used for subsequent calculations are the mean for the @RISK distribution in the third column. Figure illustrates the probabilistic input using @RISK.
If using @RISK to perform probabilistic analysis, delete unnecessary calculation worksheets because the simulation is performed for all worksheets in the workbook, and this is time consuming. If cycling through iterations using @RISK, the displayed results are no longer mean values of the random variables; they are the selected iteration’s values.
Blanket Theory Assumptions
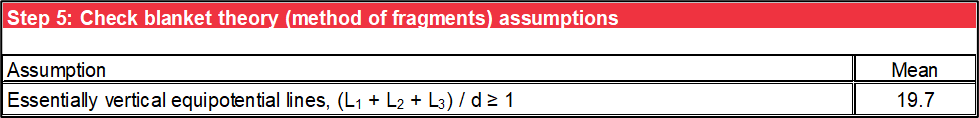
Step 5 checks the BT (method of fragments) assumptions against the input parameters to ensure essentially vertical equipotential lines. For deterministic analysis, the assumptions are checked for the most likely values of the random variables. For probabilistic analysis, the assumptions are checked for the mean values of the random variables. Values outside of the model assumptions have an orange background. Figure illustrates the check of BT assumptions.
Seepage Characterization
Step 6 calculates the net hydraulic head on the levee (H) is calculated the same as in Case 1. The flow or seepage per unit length of the levee (QS) is calculated using Equation.
where:
kh,f = horizontal permeability of the pervious substratum
H = net hydraulic head on the levee
L1 = distance from the riverside levee toe to the river
L2 = base width of the levee
L3 = length of the foundation and top stratum beyond the landside levee toe
d = thickness of the pervious substratum
The format for the tabular output is the same as in Case 1.
Likelihood of Heave/Blowout at Landside Toe
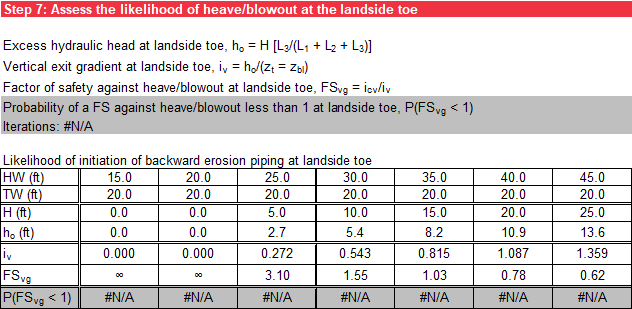
Step 7 calculates the excess hydraulic head at the landside levee toe (ho) using Equation.
where:
H = net hydraulic head on the levee
L1 = distance from riverside levee toe to the river
L2 = base width of the levee
L3 = length of the foundation and top stratum beyond the landside levee toe
The vertical seepage exit gradient at the landside levee toe (iv) is calculated using Equation.
where:
ho = excess hydraulic head at the landside levee toe
zbl = thickness of the landside blanket (top stratum)
The factor of safety against heave/blowout (based on vertical seepage gradients) at the landside levee toe (FSvg) is calculated using Equation.
where:
icv = critical vertical seepage exit gradient for heave/blowout
iv = vertical seepage exit gradient at the landside levee toe
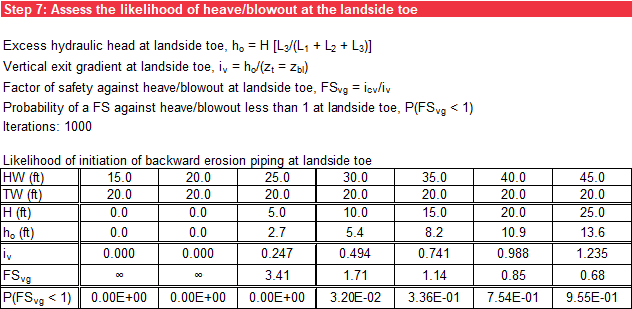
For deterministic analysis, FSvg is calculated for each headwater level using the most likely values of the random variables and is summarized in a table. Cells that do not apply have a gray background. For probabilistic analysis, FSvg is calculated as described for the deterministic analysis but for the mean values of the random variables, and multiple iterations are performed by sampling the distributions in steps 3 and 4. The probability of heave/blowout is equal to the percentage of iterations that resulted in a FSvg less than 1 [P(FSvg < 1)]. For probabilistic analysis performed without using @RISK, 1,000 iterations are used. For probabilistic analysis using @RISK, the number of iterations is user-specified, and “@RISK” displays in parentheses after the number of iterations for this scenario. If cycling through iterations using @RISK, the displayed results are no longer mean values; they are the selected iteration’s values. For deterministic and probabilistic analyses, cells with FSvg less than 1 have an orange background. Figure illustrates the deterministic tabular output, and Figure illustrates the probabilistic tabular output without using @RISK.
At the end of step 7, summary plots are generated. The first plot is the mean FS against heave/blowout (red solid line) and vertical seepage exit gradient at the landside levee toe (green solid line) as functions of headwater level. FSvg is plotted on the primary y-axis, and iv is plotted on the secondary y-axis. Horizontal reference lines display for the mean critical vertical seepage exit gradient (green dashed line) and FSvg of 1 (red dashed line). If cycling through iterations using @RISK, the displayed results are no longer mean values; they are the selected iteration. Figure illustrates the deterministic graphical output.
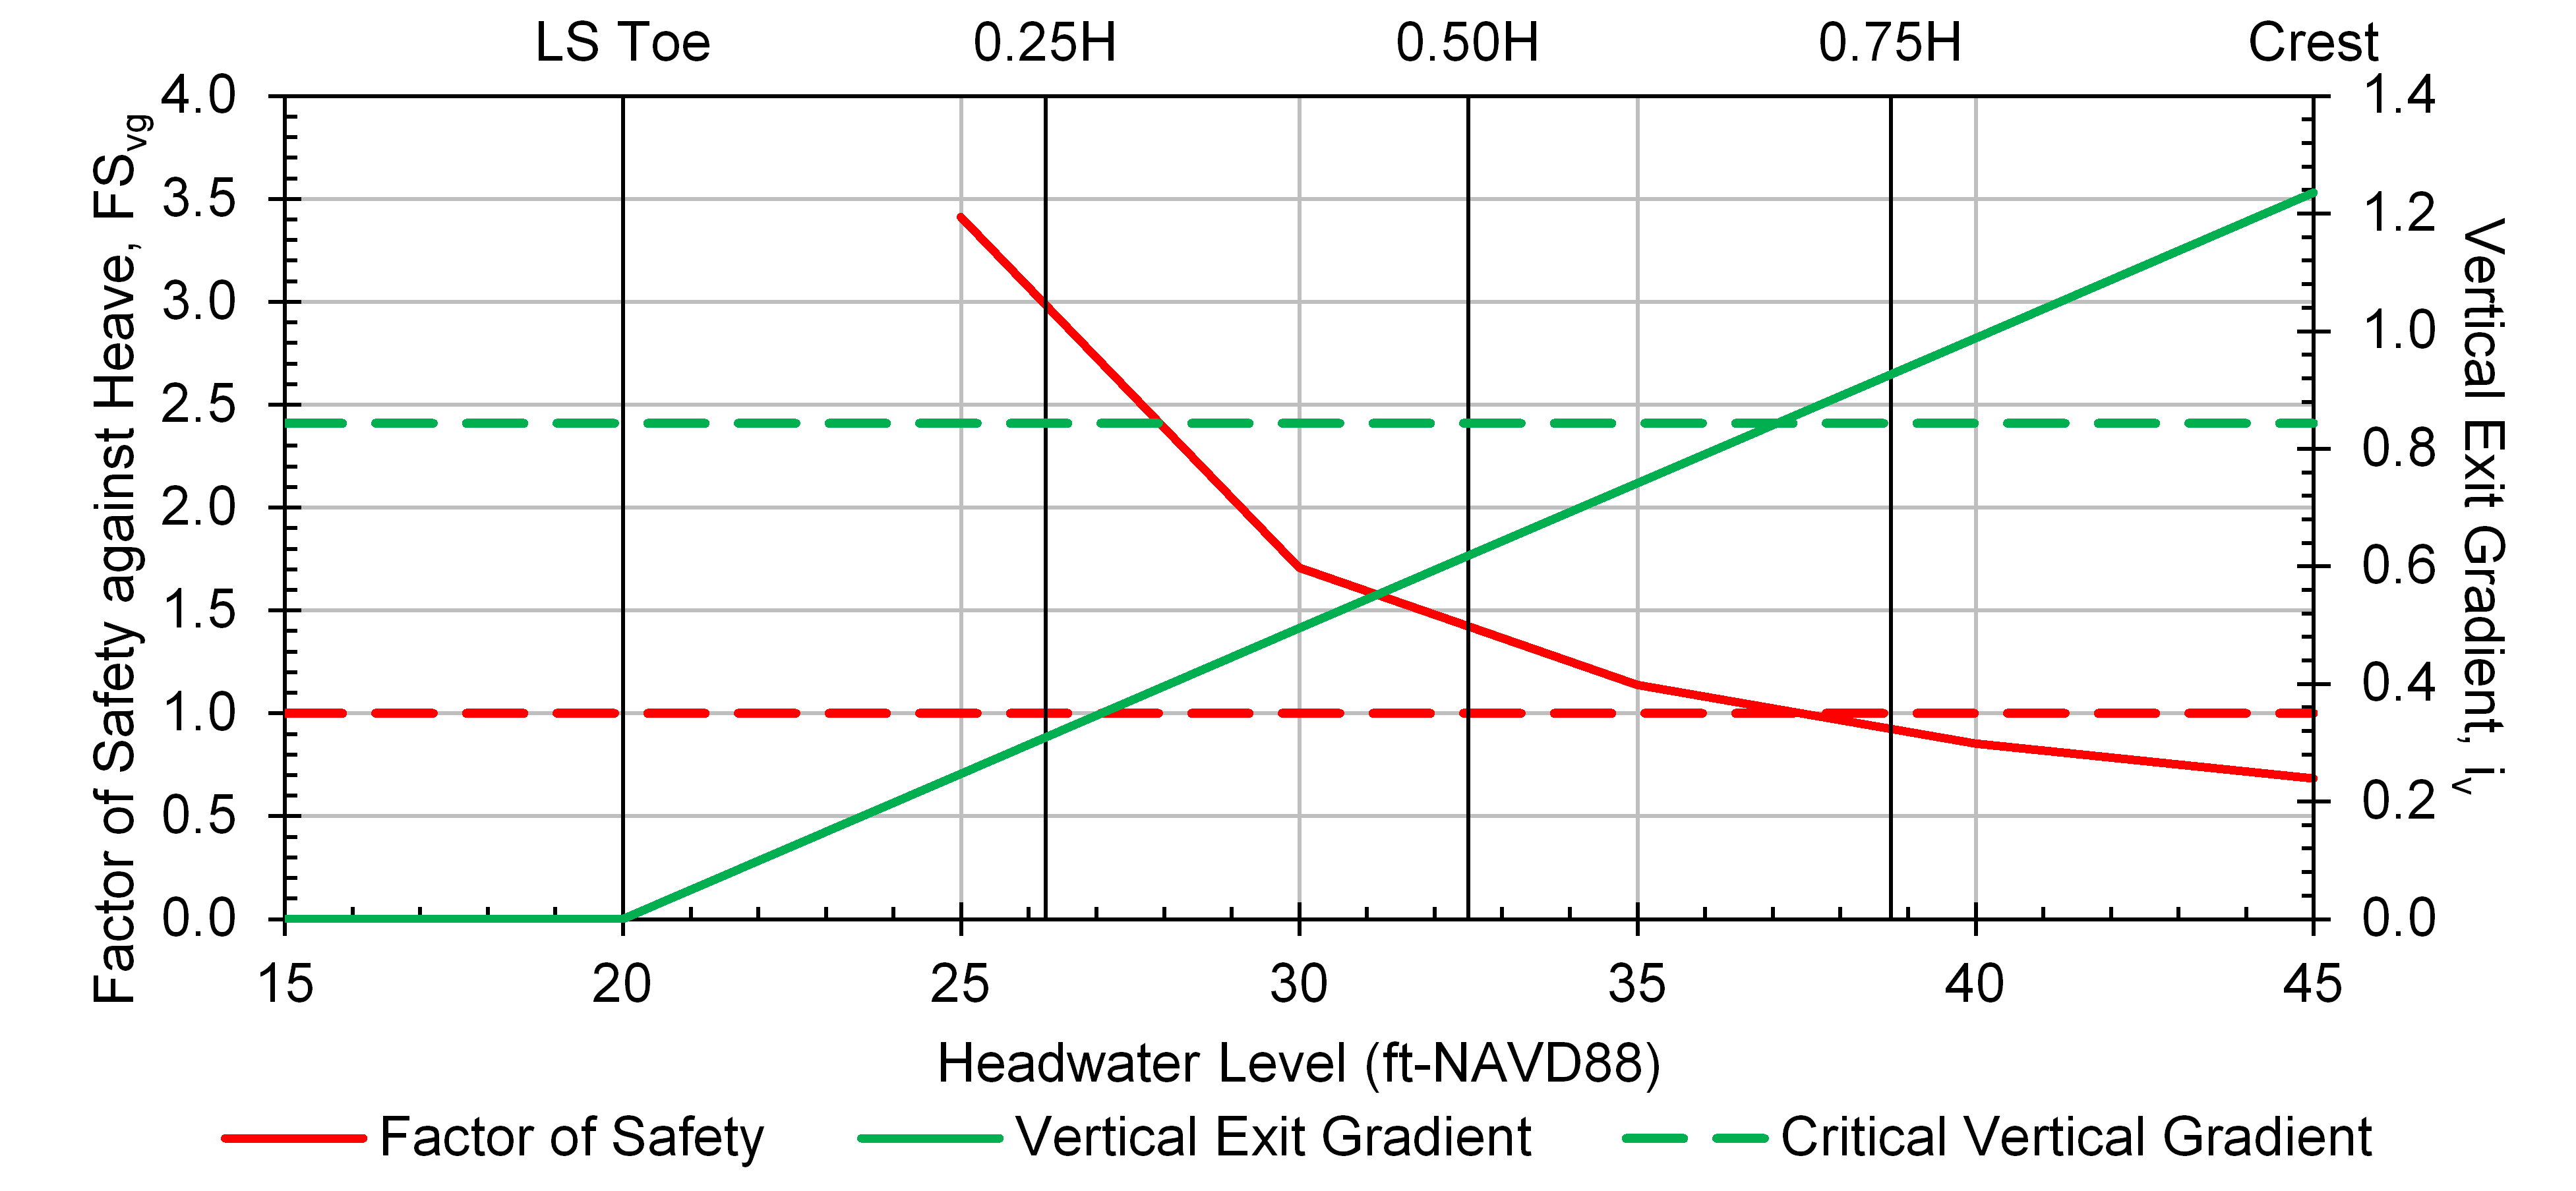
Figure illustrates the plot options for this chart. The maximum value for the primary y-axis (FSvg), maximum value for the secondary y-axis (iv), and minimum and maximum values for the x-axis (headwater level) are user-specified. The five vertical reference elevations displayed at the top of the chart correspond to 25-percent increments of the levee height (levee crest elevation minus levee landside toe elevation) and cannot be changed.

For probabilistic analysis, the mean probability of heave/blowout at the landside levee toe is plotted as a function of headwater level. If cycling through iterations using @RISK, this plot has a gray background because the probability of initiation cannot be calculated from a single iteration. Similarly, this plot has a gray background for deterministic analysis. Figure illustrates the graphical output for probabilistic analysis.
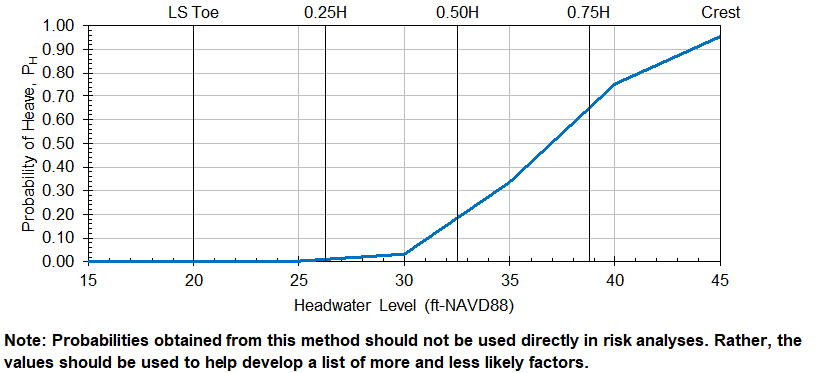
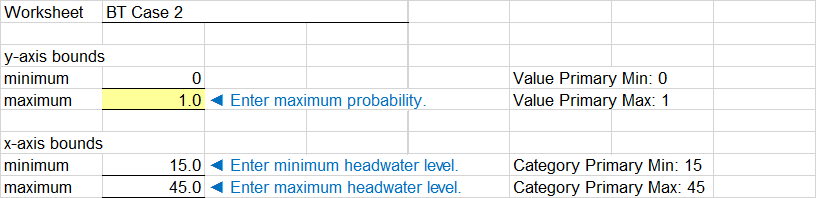
Figure illustrates the plot options for this chart. The vertical reference elevations and minimum and maximum values for the x-axis (headwater level) are the same as the previous chart. Only the maximum value for the y-axis (probability of heave/blowout) is user-specified.

Likelihood of Heave/Blowout at Given Distance from Landside Toe
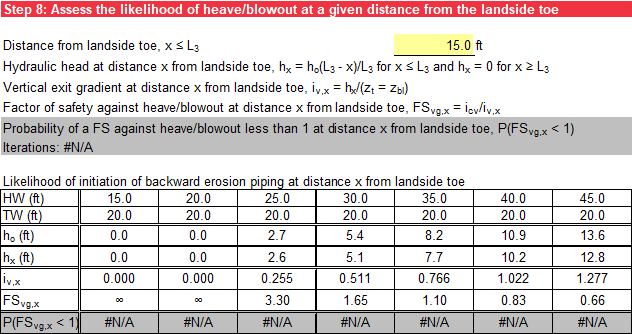
Step 8 calculates the excess hydraulic head at a distance x from the landside levee toe (hx) using Equation.
where:
ho = excess hydraulic head at the landside levee toe
L3 = length of the foundation and top stratum beyond the landside levee toe
x = distance from the landside levee toe
The vertical seepage exit gradient at a distance x from the landside levee toe (iv,x) is calculated using Equation 12.
where:
hx = excess hydraulic head at a distance x from the landside levee toe
zbl = thickness of the landside blanket (top stratum)
The factor of safety against heave/blowout (based on vertical seepage gradients) at a distance x from the landside levee toe (FSvg,x) is calculated using Equation.
where:
icv = critical vertical seepage exit gradient for heave/blowout
iv,x = vertical seepage exit gradient at a distance x from the landside levee toe
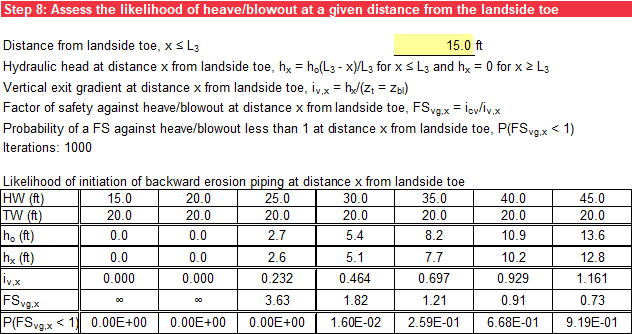
For deterministic analysis, FSvg,x is calculated for each headwater level using the most likely values of the random variables and is summarized in a table. Cells that do not apply have a gray background. For probabilistic analysis, FSvg,x is calculated as described for the deterministic analysis but for the mean values of the random variables, and multiple iterations are performed by sampling the distributions in steps 3 and 4. The probability of heave/blowout at a distance x from the landside levee is equal to the percentage of iterations that resulted in a FSvg,x less than 1 [P(FSvg,x < 1)]. For probabilistic analysis performed without using @RISK, 1,000 iterations are used. For probabilistic analysis using @RISK, the number of iterations is user-specified, and “@RISK” displays in parentheses after the number of iterations for this scenario. If cycling through iterations using @RISK, the displayed results are no longer mean values; they are the selected iteration’s values. For deterministic and probabilistic analyses, cells with FSvg,x less than 1 have an orange background. Figure illustrates the deterministic tabular output, and Figure illustrates the probabilistic tabular output without using @RISK.
At the end of Step 8, summary plots are generated after the tabular output. The first plot is the mean FS against heave/blowout at a distance x from the landside levee (red solid line) and vertical seepage exit gradient at a distance x from the landside levee toe (green solid line) as functions of headwater level. FSvg,x is plotted on the primary y-axis, and iv,x is plotted on the secondary y-axis. Horizontal reference lines display for the mean critical vertical seepage exit gradient (green dashed line) and FSvg,x of 1 (red dashed line). If cycling through iterations using @RISK, the displayed results are no longer mean values; they are the selected iteration. Figure illustrates the deterministic graphical output.
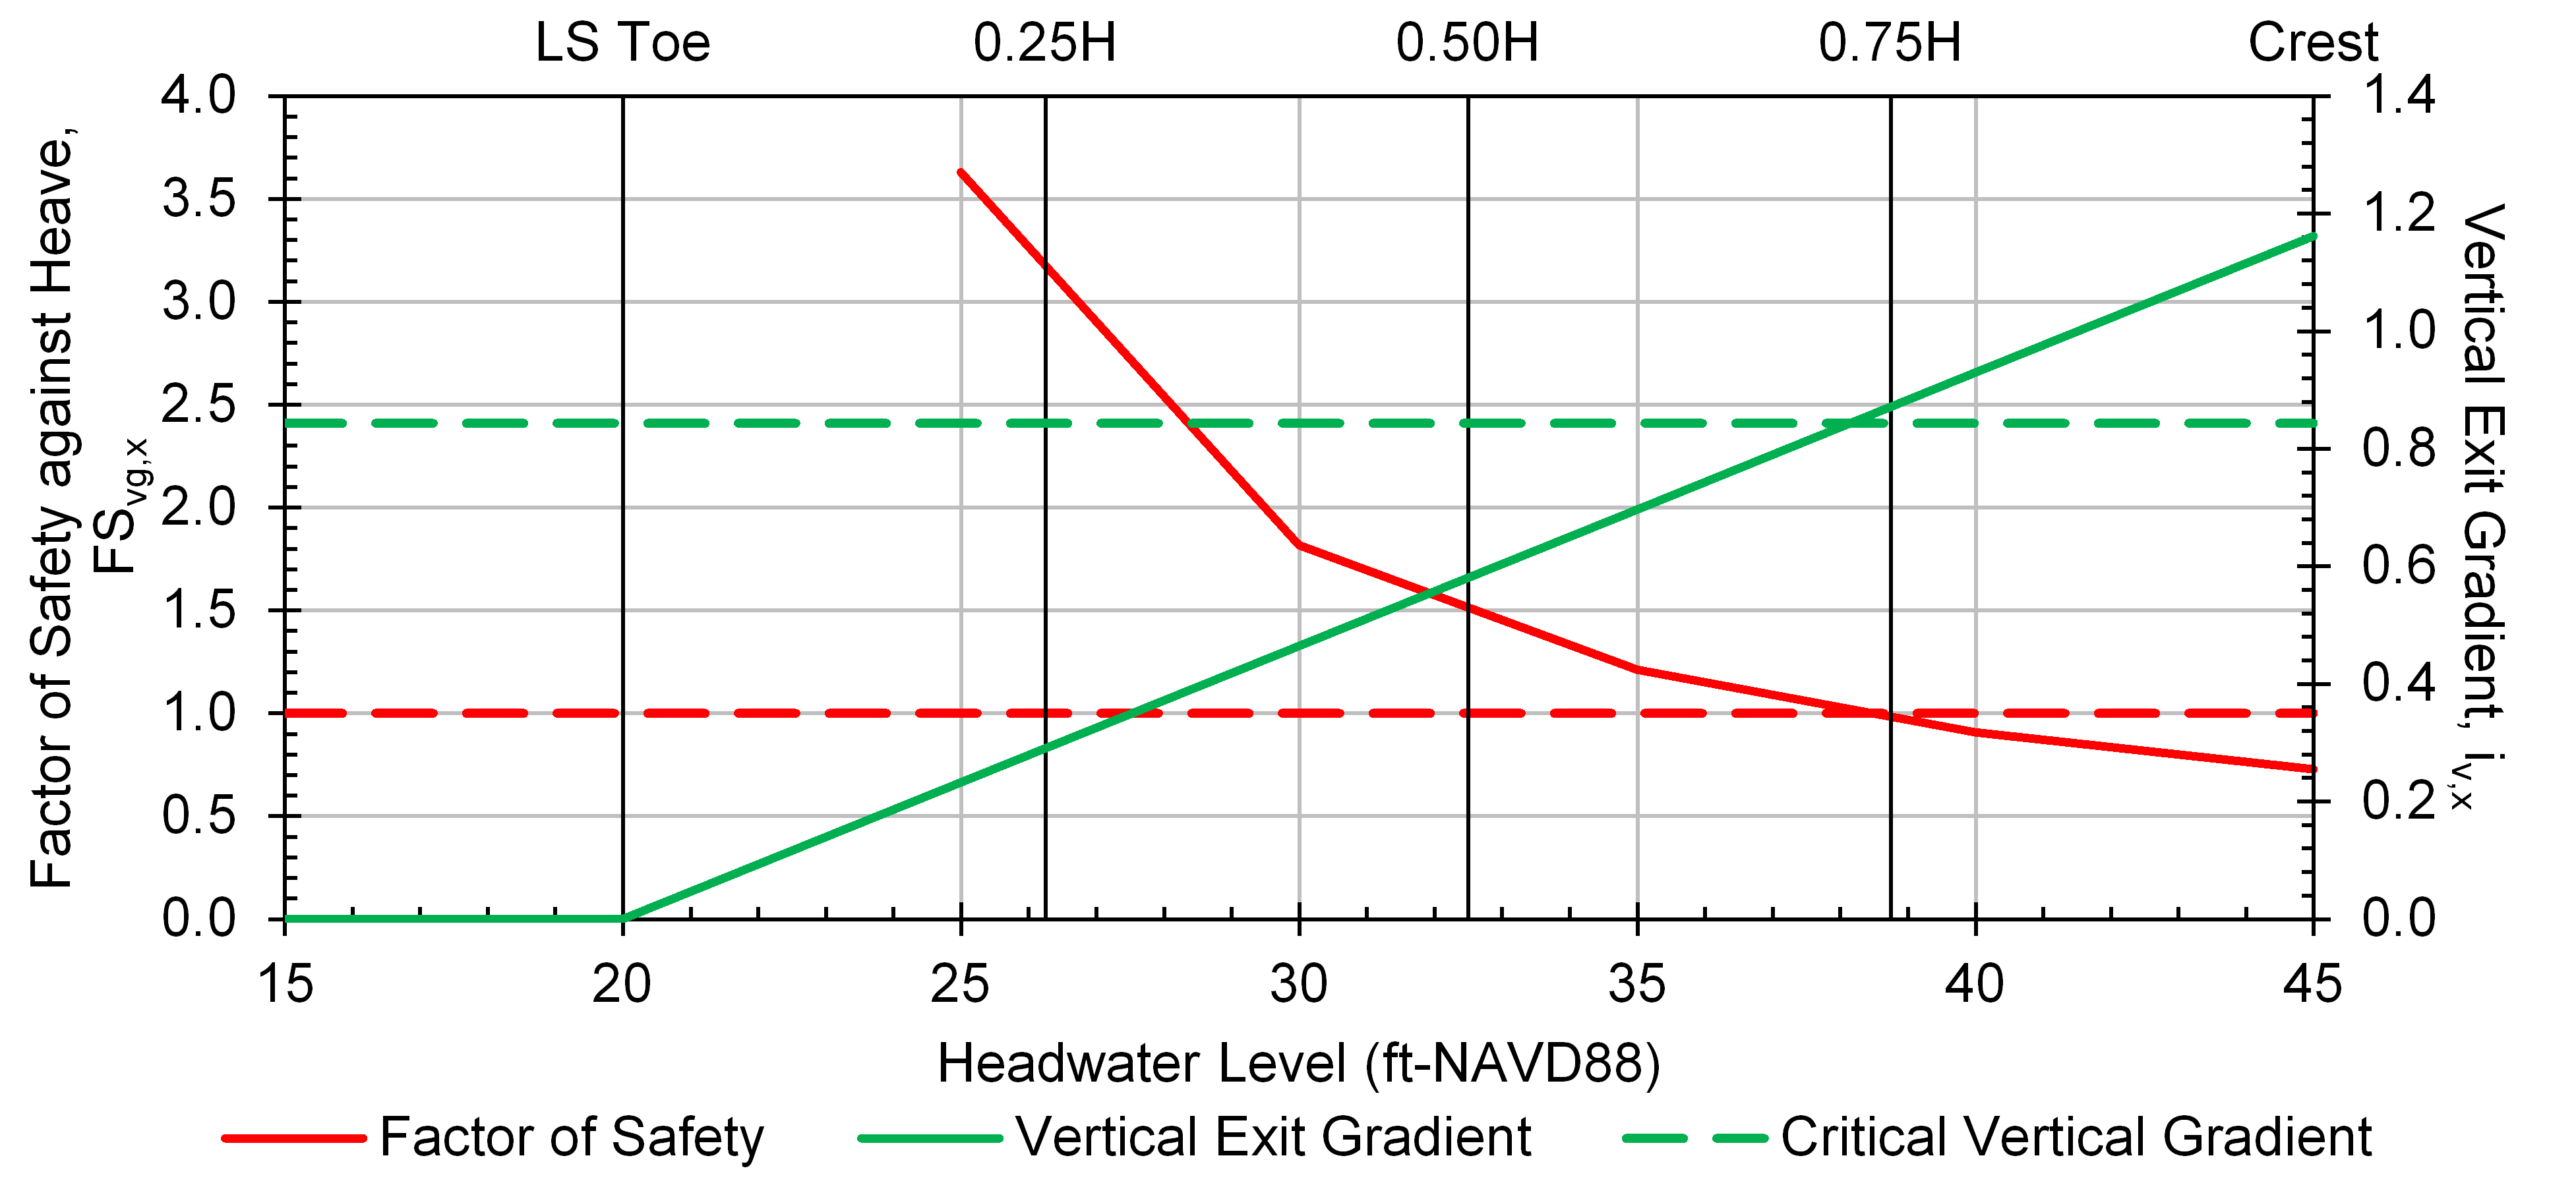
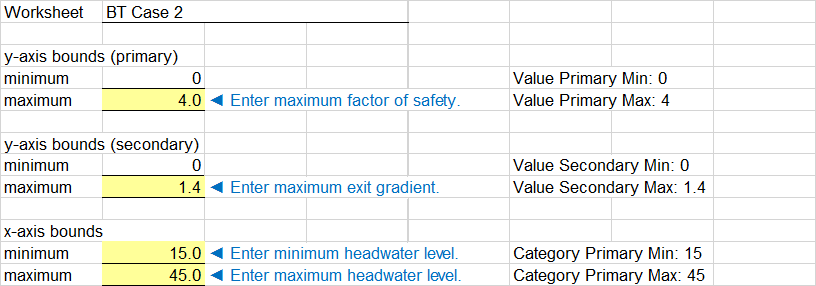
Figure illustrates the plot options for this chart. The maximum value for the primary y-axis ( _ FSvg,x_ ), maximum value for the secondary y-axis (iv,x), and minimum and maximum values for the x-axis (headwater level) are user-specified. The five vertical reference elevations displayed at the top of the chart correspond to 25-percent increments of the levee height (levee crest elevation minus levee landside toe elevation) and cannot be changed.
For probabilistic analysis, the mean probability of heave/blowout at a distance x from the landside levee is plotted as a function of headwater level. If cycling through iterations using @RISK, this plot has a gray background because the probability of initiation cannot be calculated from a single iteration. Similarly, this plot has a gray background for deterministic analysis. Figure illustrates the probabilistic graphical output.
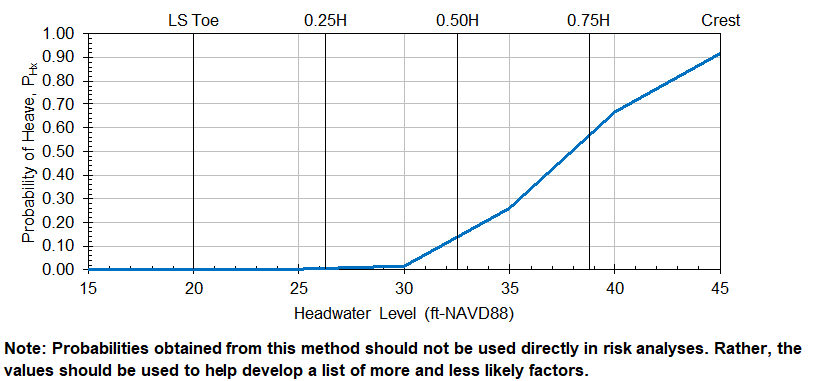
Figure illustrates the plot options for this chart. The vertical reference elevations and minimum and maximum values for the x-axis (headwater level) are the same as the previous. Only the maximum value for the y-axis (probability of heave/blowout) is user-specified.