
Blanket Theory Case 1
Case 1 has no landside and riverside top stratum (no blankets). The pervious substratum is divided into three zones to apply the method of fragments as shown in step 2 (Figure).
Method of Analysis
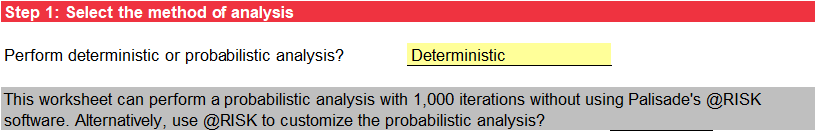
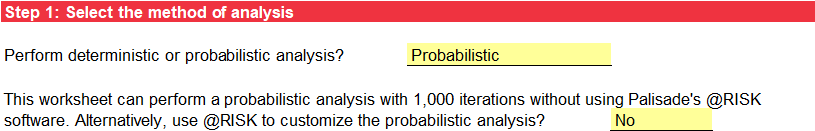
In step 1, use the drop-down list to select the method of analysis (probabilistic or deterministic). There are two options for probabilistic analysis. The first performs 1,000 iterations (judged adequate for most applications) without using Palisade’s @RISK software. This provides flexibility if an @RISK software license is not available. The second uses @RISK to customize the probabilistic analysis. Use the drop-down list to select Yes if @RISK is used and No if @RISK is not used. Figure through Figure illustrate the three possible scenarios.

Levee Geometry
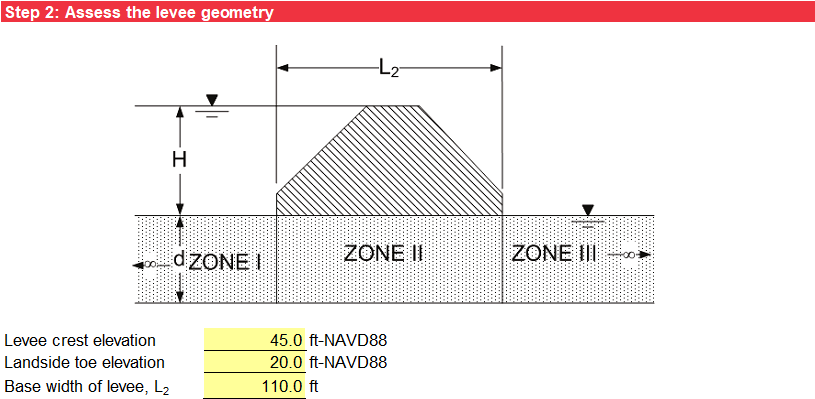
Step 2 characterizes the levee geometry. The input includes the levee crest elevation, landside levee toe elevation, and base width of levee (L2) as illustrated in Figure.
Pervious Substratum Characterization
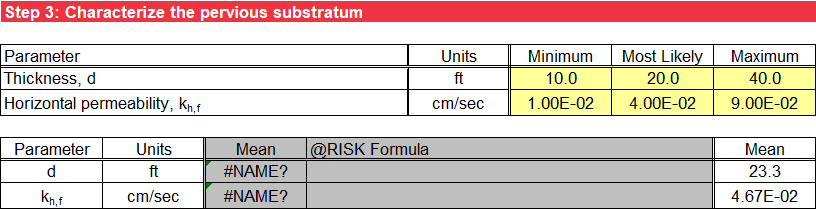
Step 3 characterizes the pervious stratum. The selections in step 1 affect the input for step 3, and cells that do not apply have a gray background. These cells are not used in subsequent calculations even if data is present. The input includes the thickness (d) and horizontal permeability (kh,f) of the pervious substratum.
For deterministic analysis, input only the most likely values. The mean values used for subsequent calculations are the most likely (or mode) values. Figure illustrates the deterministic input.
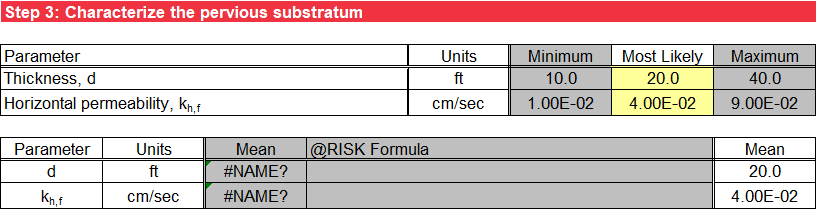
For probabilistic analysis without using @RISK, input the minimum and maximum values in addition to the most likely value, and triangular distributions represent the random variables. The mean values used in subsequent calculations are the average of the minimum, most likely, and maximum values. Figure illustrates the probabilistic input without using @RISK.
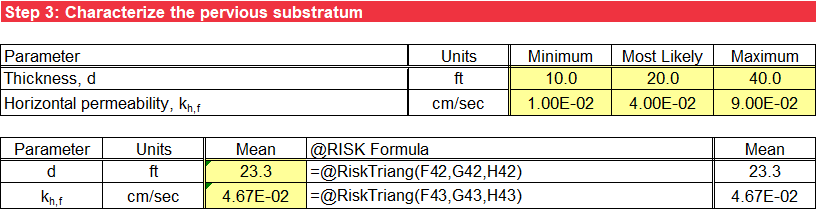
For probabilistic analysis using @RISK, input the minimum, most likely, and maximum values, and use an @RISK formula for a triangular distribution in the third column as a default. Alternatively, input a valid @RISK distribution in lieu of this default formula, and the user-specified input displays in the fourth column. The mean values used for subsequent calculations are the mean for the @RISK distribution entered in the third column. Figure illustrates the probabilistic input using @RISK.
If using @RISK to perform probabilistic analysis, delete unnecessary calculation worksheets because the simulation is performed for all worksheets in the workbook, which this is time consuming. If cycling through iterations using @RISK, the displayed results are no longer mean values of the random variables; they are the selected iteration.
Blanket Theory Assumptions
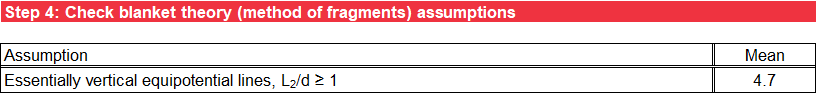
Step 4 checks the BT (method of fragments) assumptions against the input parameters to ensure essentially vertical equipotential lines. For deterministic analysis, the assumptions are checked for the most likely values of the random variables. For probabilistic analysis, the assumptions are checked for the mean values of the random variables. Values outside of the model assumptions have an orange background. Figure illustrates the check of BT assumptions.
Seepage Characterization
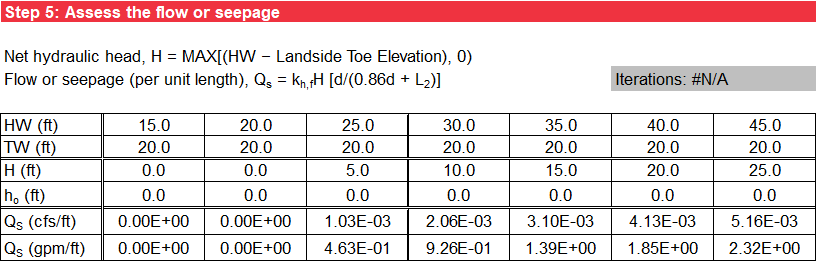
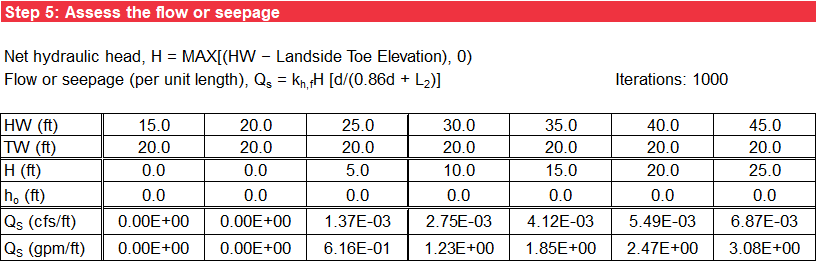
Step 5 calculates the net hydraulic head on the levee (H) using Equation.
where:
HW = headwater level
TW = tailwater level
The flow or seepage per unit length of the levee (Qs) is calculated using Equation.
where:
kh,f = horizontal permeability of the pervious substratum
H = net hydraulic head on the levee
L2 = base width of the levee
d = thickness of the pervious substratum
For deterministic analysis, Qs is calculated for each headwater level using the most likely values of the random variables and is summarized in a table. Cells that do not apply have a gray background. For probabilistic analysis, Qs is calculated as described for the deterministic analysis but for the mean values of the random variables, and multiple iterations are performed by sampling the distributions in step 3. For probabilistic analysis without using @RISK, 1,000 iterations are used. For probabilistic analysis using @RISK, the number of iterations is user-specified. If cycling through iterations using @RISK, the displayed results are no longer mean values; they are the selected iteration. Figure illustrates the deterministic output, and Figure illustrates the probabilistic output without using @RISK.
Likelihood of Heave/Blowout at Landside Toe
Since the excess hydraulic head at the landside levee toe is zero, vertical seepage exit gradients are not computed for this case.
Likelihood of Heave/Blowout at Given Distance from Landside Toe
Since the excess hydraulic head at the landside levee toe and at any distance x from the landside levee toe are zero, vertical seepage exit gradients at any distance x from the landside levee toe are not computed for this case.