
Midland Dams
Edenville Dam and (subsequently) Sanford Dam in Midland County, Michigan, United States.
🡇 Download ModelOverview
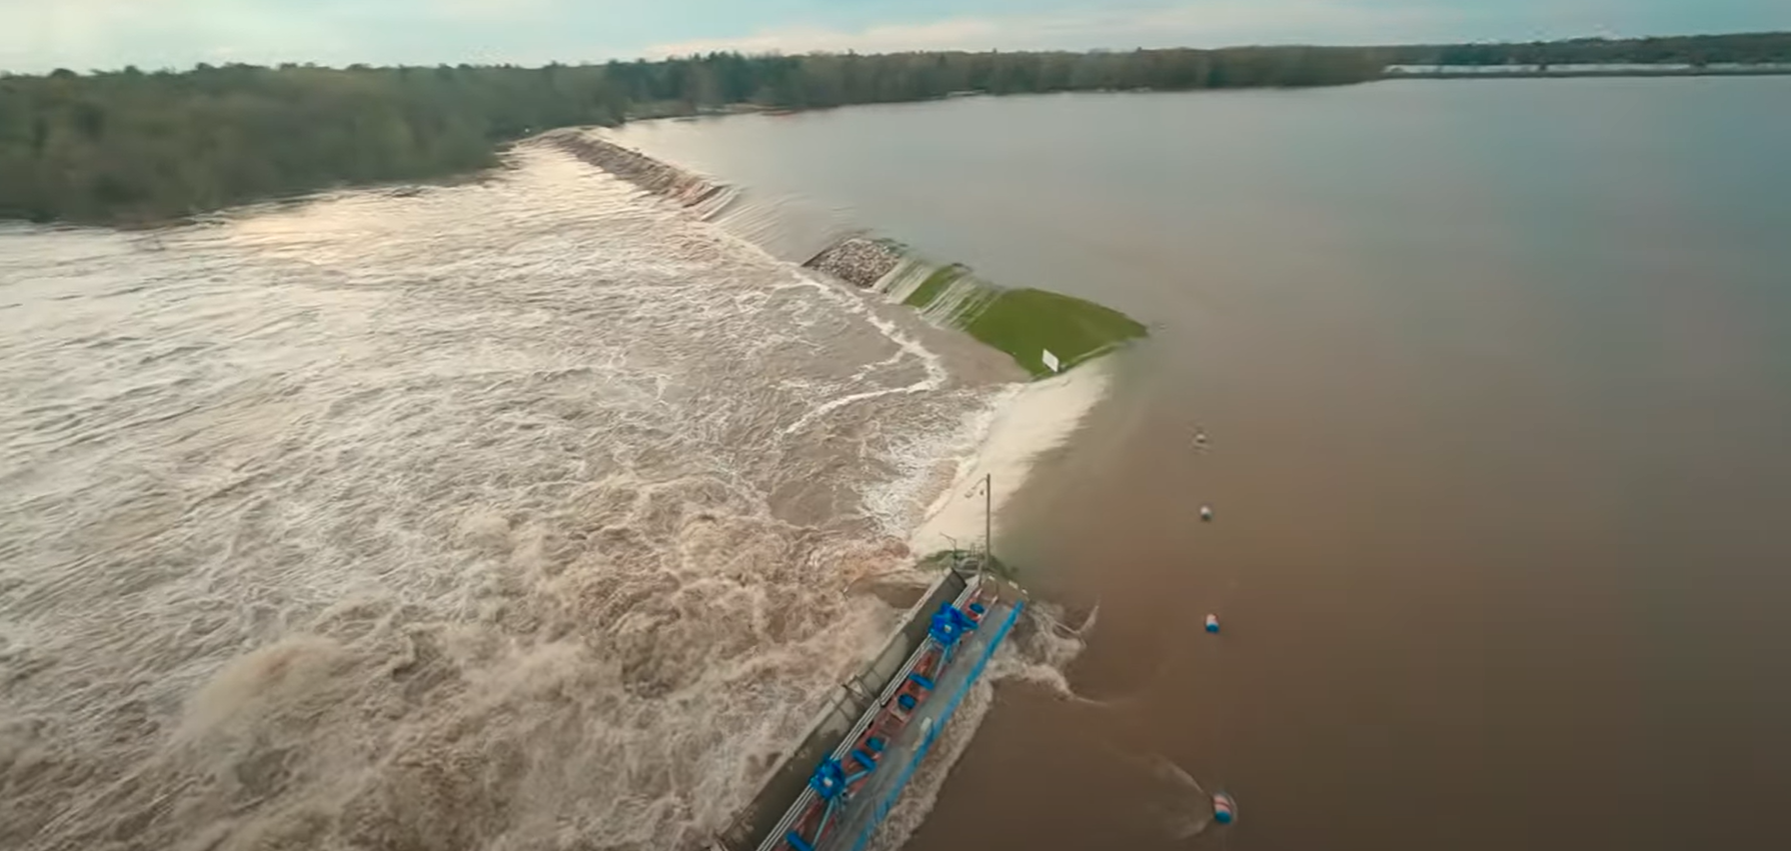
A stalled low-pressure system brought heavy rainfall to Michigan’s Lower Peninsula from May 17-19, 2020. The rainfall contributed to the failure of Edenville Dam in Edenville, MI (Figure) and the subsequent failure of Sanford Dam in Sanford, MI (Figure), on May 19, 2020. The two dam failures and resultant flooding triggered evacuation of approximately 11,000 people in the Midland County area.
Zero fatalities occurred.
RMC considered these specific circumstances worthy of a validation data set as they had previously lacked case studies with significant flooding and zero fatalities. The timing and geographic extent of the case also lent themselves to feasible model development.

Data
Data was collected by HDR, Inc. (HDR) from several sources, both official and unofficial, to support the hydraulic modeling and evacuation scenarios in LifeSim. The U.S. Army Corps of Engineers (USACE) and Federal Energy Regulatory Commission (FERC) also provided considerable support by providing existing Hydrologic Engineering Center's River Analysis System (HEC-RAS) and LifeSim models and reports concerning the dams and their history of maintenance and inspection, respectively. A partnership between Federal Emergency Management Agency (FEMA) and Argonne National Laboratory (Argonne) was also pursuing information on the evacuation warning simultaneously and provided their summary presentation to HDR.
The complete Midland Dams validation study analysis is documented in Midland MI Dam Failures Case History - Hydraulic and Consequence Modeling [?].
The following provides a short description of the data sources used for validation.
Hydraulics
Starting with the USACE-provided model, HDR developed a 2-dimensional (2D) unsteady hydraulic model of the Edenville and Sanford Dam breaches based on the best available topography data, as-built and survey drawings. HEC-RAS version 5.0.7 was utilized. Breach parameters were developed based on analysis of photos and video of the breaches in progress. The model was used to simulate the Edenville Dam breach, the subsequent Sanford Dam breach, and the flood inundation along Tittabawassee River from Sanford Dam downstream to Midland.
Timing was known for some source data and estimated for others by analysis of the event chronology.
Structure Inventory
For the Historical Event scenario, the structure inventory was derived from the National Structure Inventory (NSI) version 2.0 [?]. Diurnal population migration patterns were not adjusted for impacts due to COVID-19 restrictions. The USACE-provided inventory was extracted with a floodplain buffer offset and covered most of the study area, specifically the areas most at risk from flooding. The modeled population is likely larger than historic because boundaries of the evacuated population were not completely known and modeling traffic congestion was a preliminary concern.
Road Network
The road network was derived from OpenStreetMap [?] and manually refined in ArcMap. The road network was trimmed down to roughly match the extent of the structure inventory, with evacuation routes extending out beyond the structure inventory extent to allow for traffic backup leading to destinations. The network represents the starting point for the Historical Event which further refined the network due to road closures.
Destinations
Fourteen destinations were created for this model. These destinations represented either major roads leading away from the affected area or known locations of mass shelter including high schools, community centers, and shopping malls. Emergency Planning Zone (EPZ) populations were directed to destinations based on proximity, interviews, and to keep evacuees away from hazardous areas.
Emergency Planning Zones
The EPZs in this study are based on flood warning and evacuation order times drawn from online emergency messaging systems and interviews with Midland County emergency managers. In total, 12 EPZs were created for the Historical Event and road closure scenarios.
In this model, Warning Issuance Delay and First Alert are considered together for all EPZs without uncertainty, to arrive at the known warning issuance time. Circumstances differed by EPZ. The first alert came in the form of a Nixle/WEA alert, volunteers announcing evacuation orders via loudspeaker and going door-to-door, or both.
All EPZs were assigned an elicited Protective Action Initiation (PAI) curve generated based on interviews with emergency managers and fire chiefs. Jerome Township and Edenville Township were assigned the same elicited PAI curve, while all other EPZs were assigned another with greater mean mobilization as they had the additional benefit of social/news media of the failure.
Alternative
The model defines different Imminent Hazard ID Times for each EPZ based on the time when a hazard is recognized to be serious enough to necessitate evacuation orders.
For the Historical Event model, four unique Imminent Hazard ID Times were used. For Edenville Township, the Edenville Fire Chief was made aware of a potential failure of Smallwood Dam sometime on May 18th via a phone call from Midland EM. For Jerome Township EPZ, the decision to evacuate came from Midland County EM. Northwood University EPZ is based on interview information from the University’s director. A fourth Imminent Hazard ID Time applied to all other EPZs.
The Hazard Communication Delay represents the elapsed time from when the imminent hazard is identified to when the party responsible for evacuations is made aware of the situation. These were selected according to historic timestamps obtained from Edenville Fire Chief, Jerome Township Fire Chief, and Emergency Management Officials.
Modeling Conclusion
Life Loss Differences
The model’s life loss (compared to the real event’s zero fatalities) is primarily located in hot spots shown in Figure.
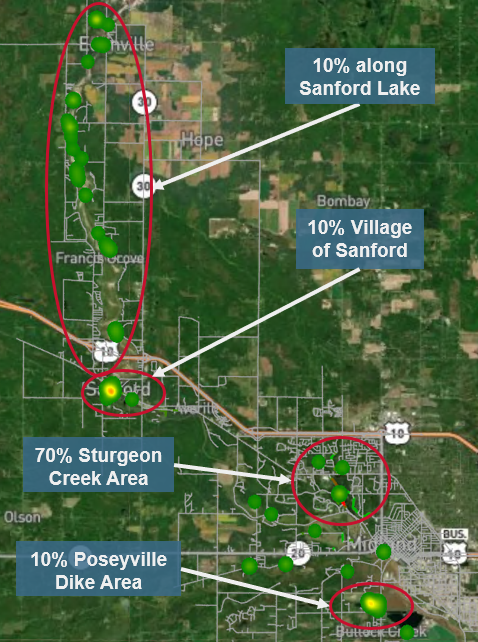
It was determined after the creation of the model the following two areas received an early warning with successful evacuation, contributing to the difference between estimated model life loss and zero real-event fatalities.
- "Sturgeon Creek Area" (Figure): W Main St and an adjacent neighborhood northeast of Northwood University.
- "Poseyville Dike Area" (Figure): Industrial area along Venture Dr and S Poseyville Rd.
Modeling Lessons Learned
- Value of a well-attended table-top exercise.
- Early evacuation saved lives.
- Knowing the hazard and resources justified that call.
- Evacuation proceeded in order from the dam to downstream.
- With alerts and info, some people will evacuate before the official evacuation order.
- Evacuation from home with family has different considerations than evacuation from work, especially if the workers’ homes are not impacted.
- Example: Dow facility and Northwood University. Also anecdotal mentions about trying to save books at the Dow Memorial Library.
- Roads closed due to flooding or as a precaution can reduce life loss.
- Ensure alternatives are safe before closing any roads.
Model Version
The original LifeSim model was developed in 2020 using LifeSim version 2.0 beta. The public model was updated in 2025 to LifeSim version 2.1.5 and produced negligible changes from the original documented results.