Modified Kenney and Lau Method
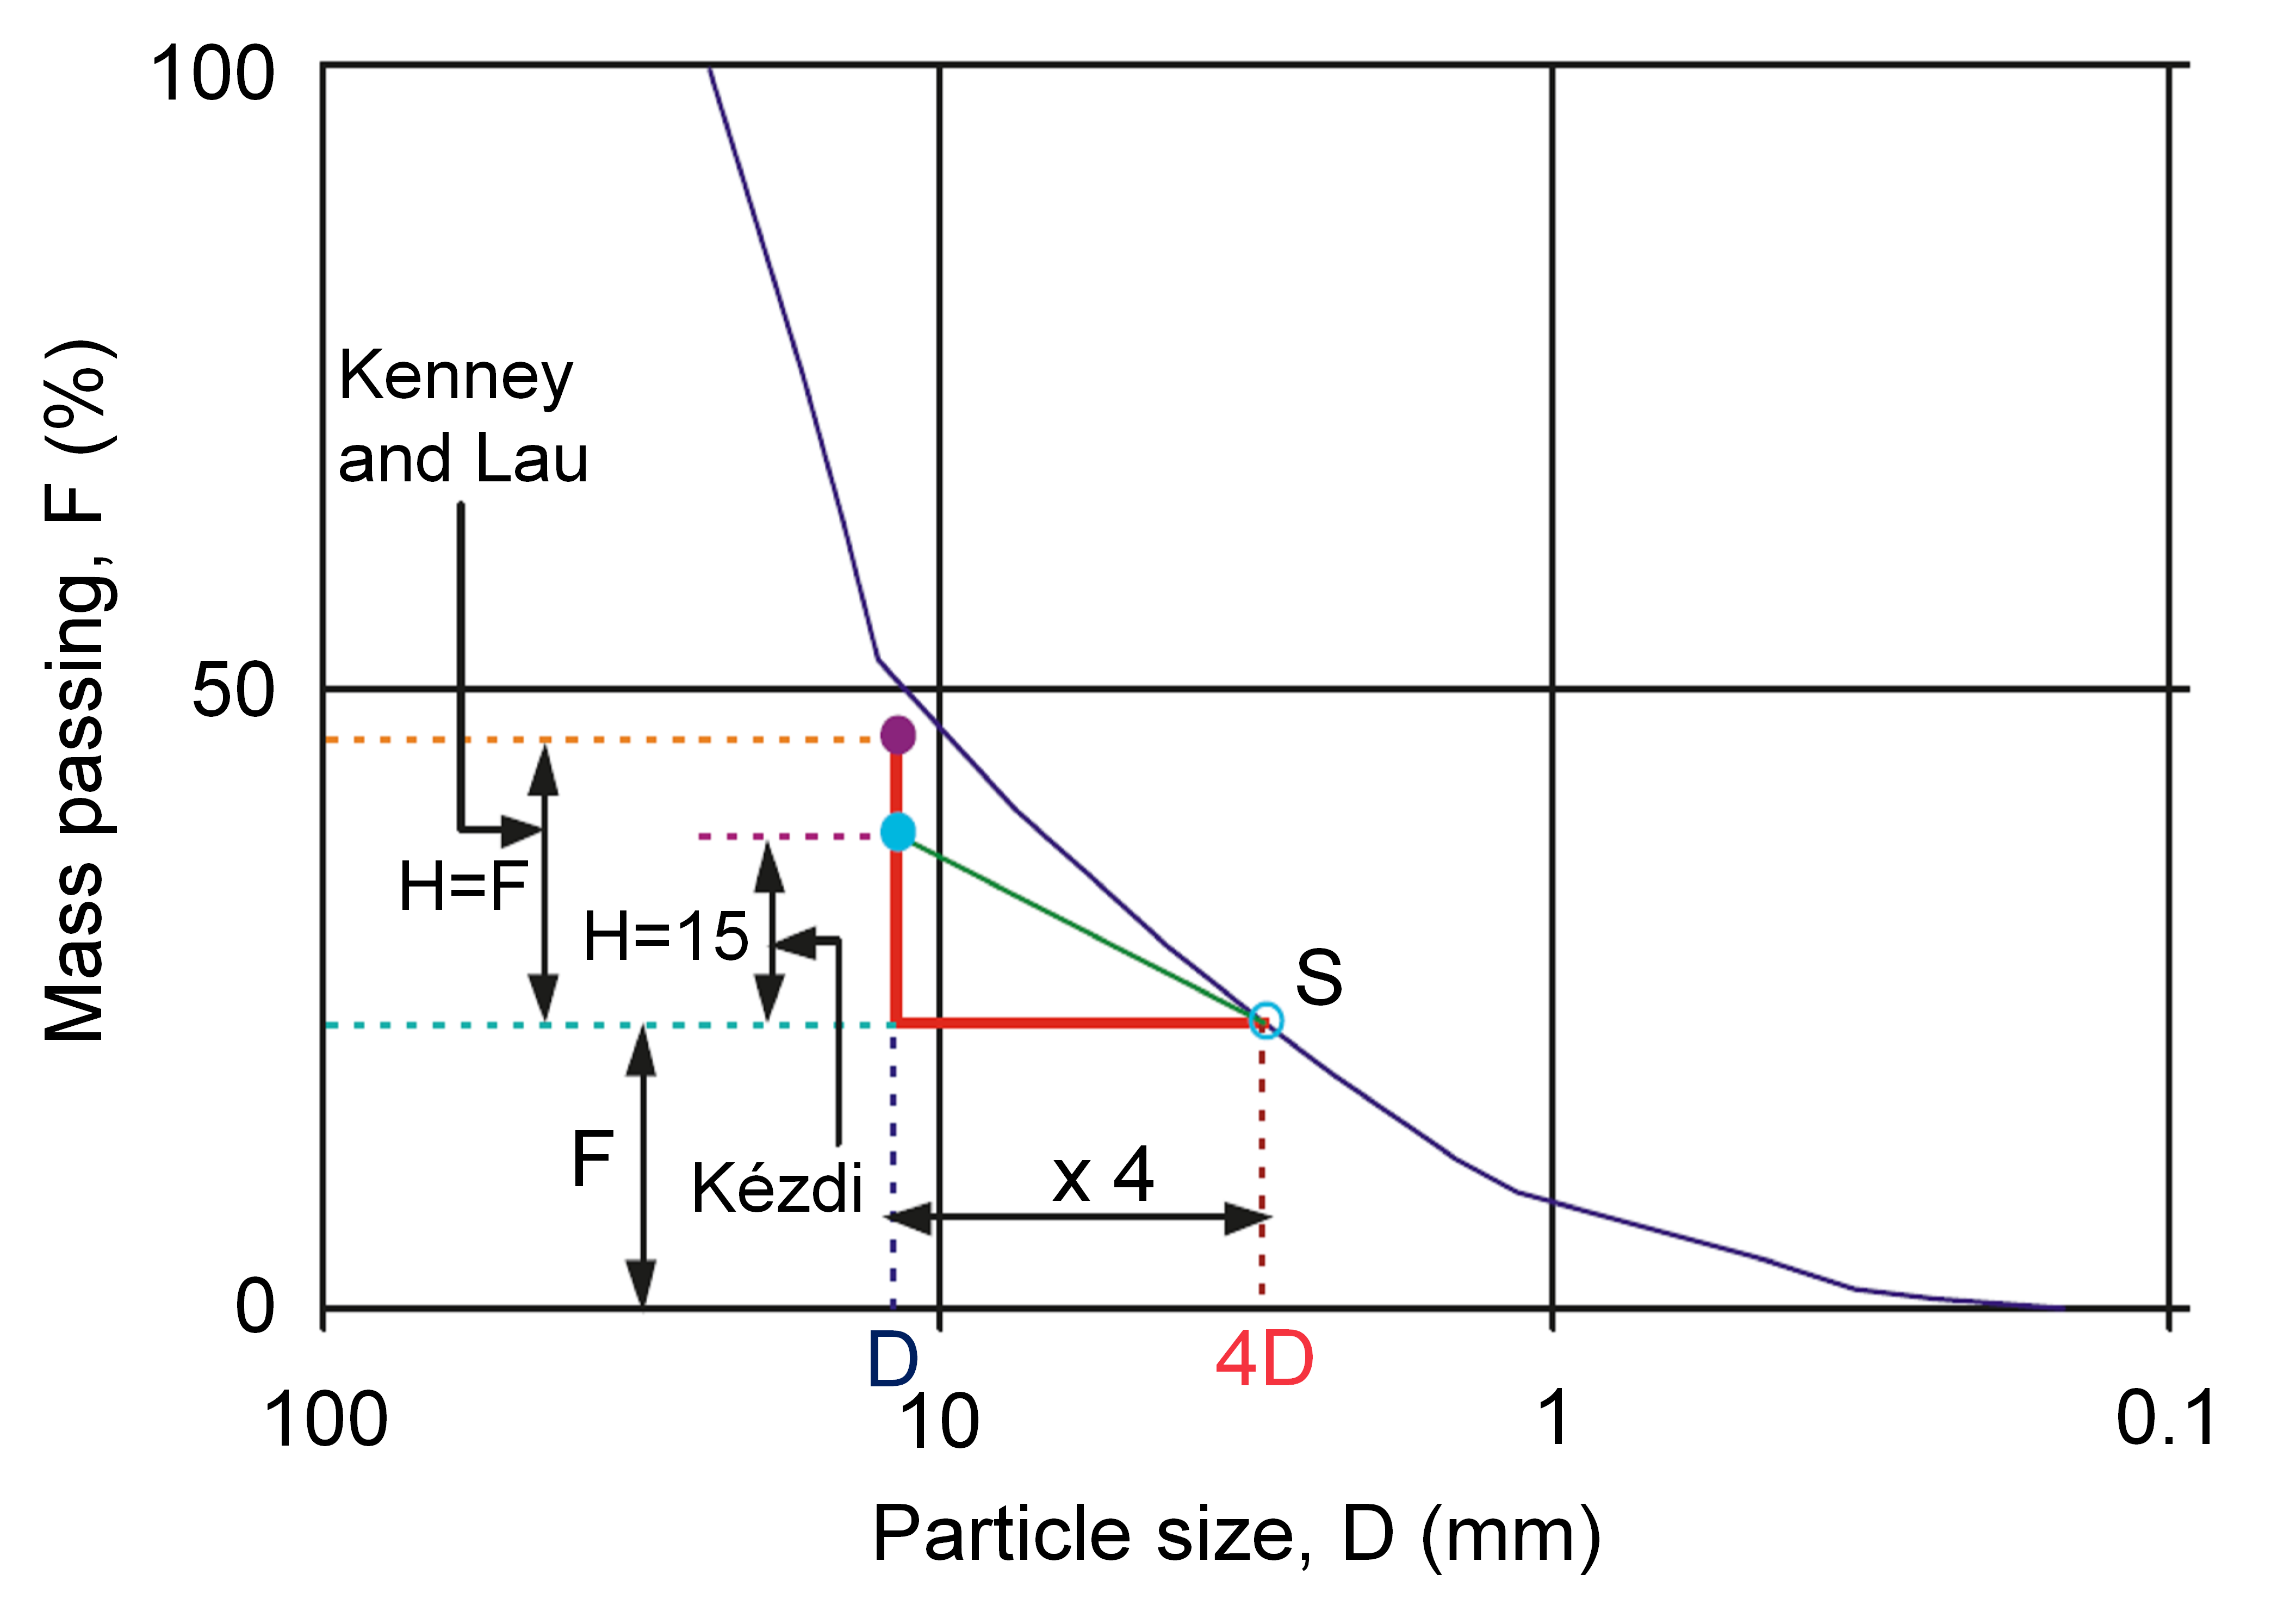
Kezdi (1979) [?] and Kenney and Lau (1985, 1986) [?] [?] are two of the earliest to assess the susceptibility to internal instability. Li and Fannin (2008) [?] summarized and compared the two methods. The secant slope of the particle-size distribution curve indicates the likelihood of internal instability. Both methods examine the slope of the gradation curve over a discrete interval of its length, but the criterion to establish the size of that interval differs, as illustrated in Figure.
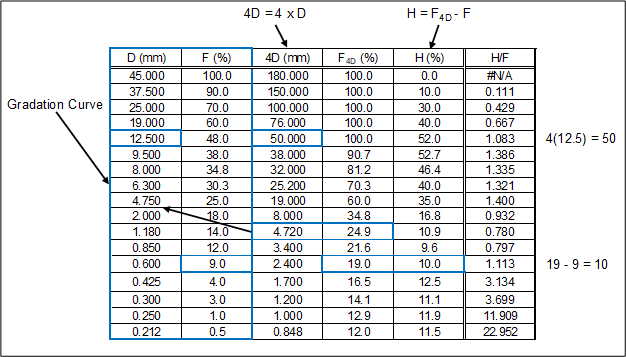
Kezdi calculates Terzaghi's filter ratio over the constant increment of percent finer by mass (H) of percent at any point along the gradation curve, where D'15 is the particle-size diameter corresponding to 15 percent passing on the cumulative particle-size distribution curve in the coarse fraction and d'85 is the particle-size diameter corresponding to 85 percent passing on the cumulative particle-size distribution curve in the finer fraction. In other words, the Kezdi criterion for internal instability is “the slope is flatter than 15% per four times change in particle size.” Kenney and Lau calculate the stability index over the increment of D to 4D. In other words, the Kenney and Lau criterion for internal instability is “the slope is flatter than F% per four times change in particle size.”
Kenney and Lau (1985, 1986) [?] [?] converted cumulative particle-size distribution curves into shape curves, or H-F plots, where F is the mass fraction smaller than particle diameter D (plotted on the x-axis) and H is the mass fraction between particle diameter D and 4D (plotted on the y-axis). An stability index over the increment D to 4D, which increases in magnitude with progression along the gradation curve, determines if a soil is potentially unstable.
The shape curve is compared to Kenney and Lau’s criterion for internal instability. In 1985, they proposed the following criterion for internal instability based on laboratory testing results, as shown in Equation.
This criterion was subsequently revised in 1986 to Equation.
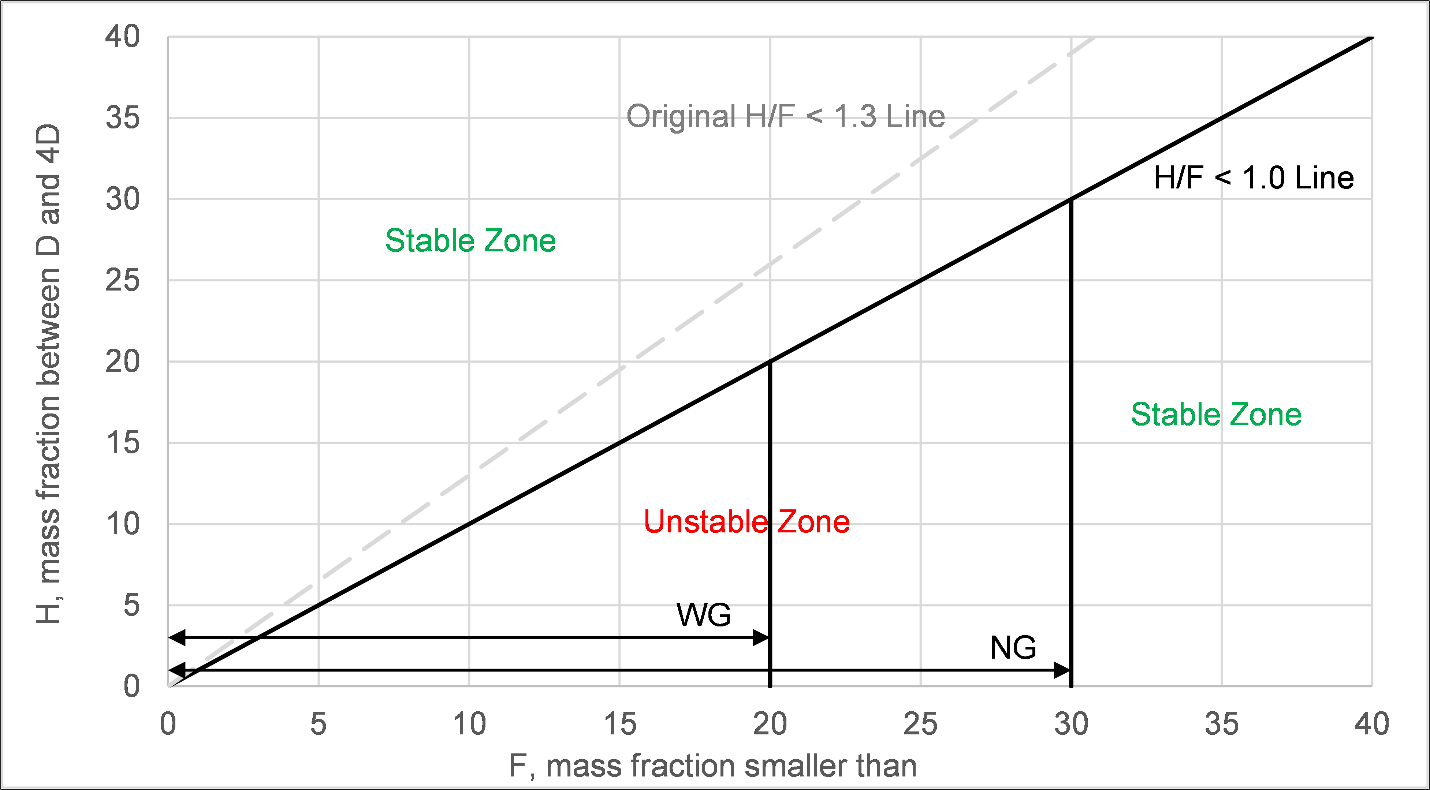
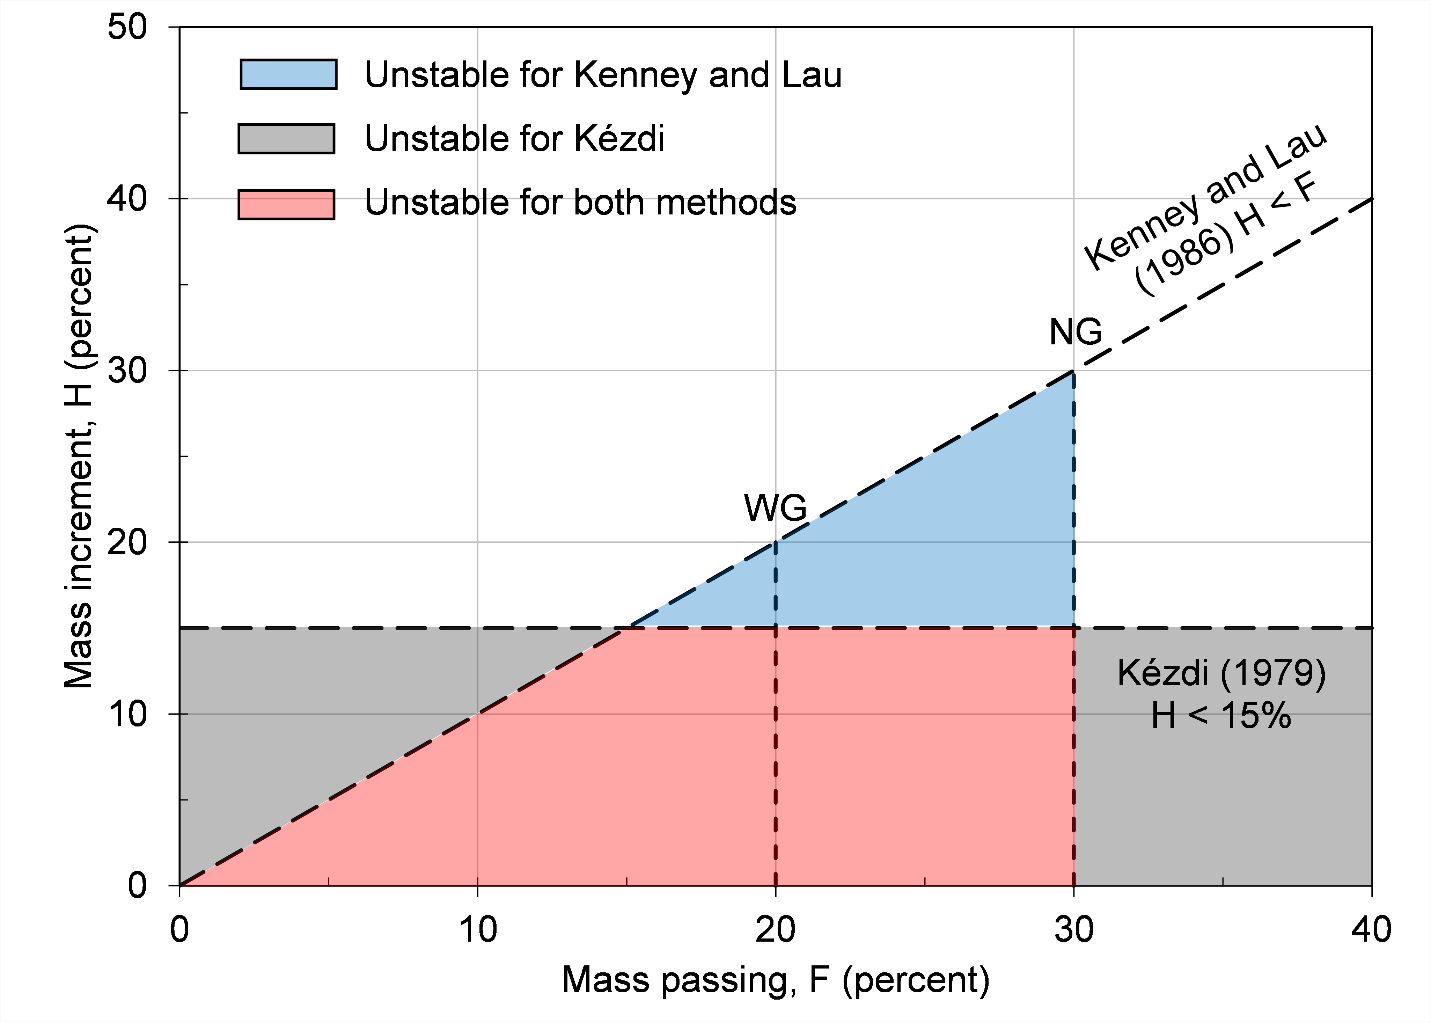
They concluded that the fraction of loose particles within a soil matrix has a maximum value corresponding to whether the gradation is narrowly graded (NG) or widely graded (WG). For NG soils , the fraction of loose particles within the soil matrix is less than approximately 30 percent of the total material. For WG soils , the fraction of loose particles is less than approximately 20 percent. Since internal instability depends on the loss of loose particles from within the soil matrix, the fraction of the soil gradation for percent for WG soils and percent for NG soils is not considered unstable if it falls below the line. Vertical boundary lines are plotted from H = 0 to H = F to represent these values. The resulting unstable zone is triangular and bounded on the left by the line and on the right by F = 20 percent for WG soils or F = 30 percent for NG soils. If any portion of the shape curve falls within the applicable triangle, that fraction of the soil gradation is considered internally unstable. Figure illustrates the original (1985) and modified (1986) internal instability criteria in (H,F) space.
Converting the soil gradation into a shape curve can also evaluate the Kezdi method. Whereas the mass increment (H) between particle diameter D and 4D for the Kenney and Lau methodology increases along the gradation curve, the mass increment (H) over D'15 and d'85 for the Kezdi methodology is constant and equal to 15 percent. The resulting unstable zone is rectangular and bounded at the top by H = 15 percent. If any portion of the shape curve falls within the rectangle, that fraction of the soil gradation is considered internally unstable.
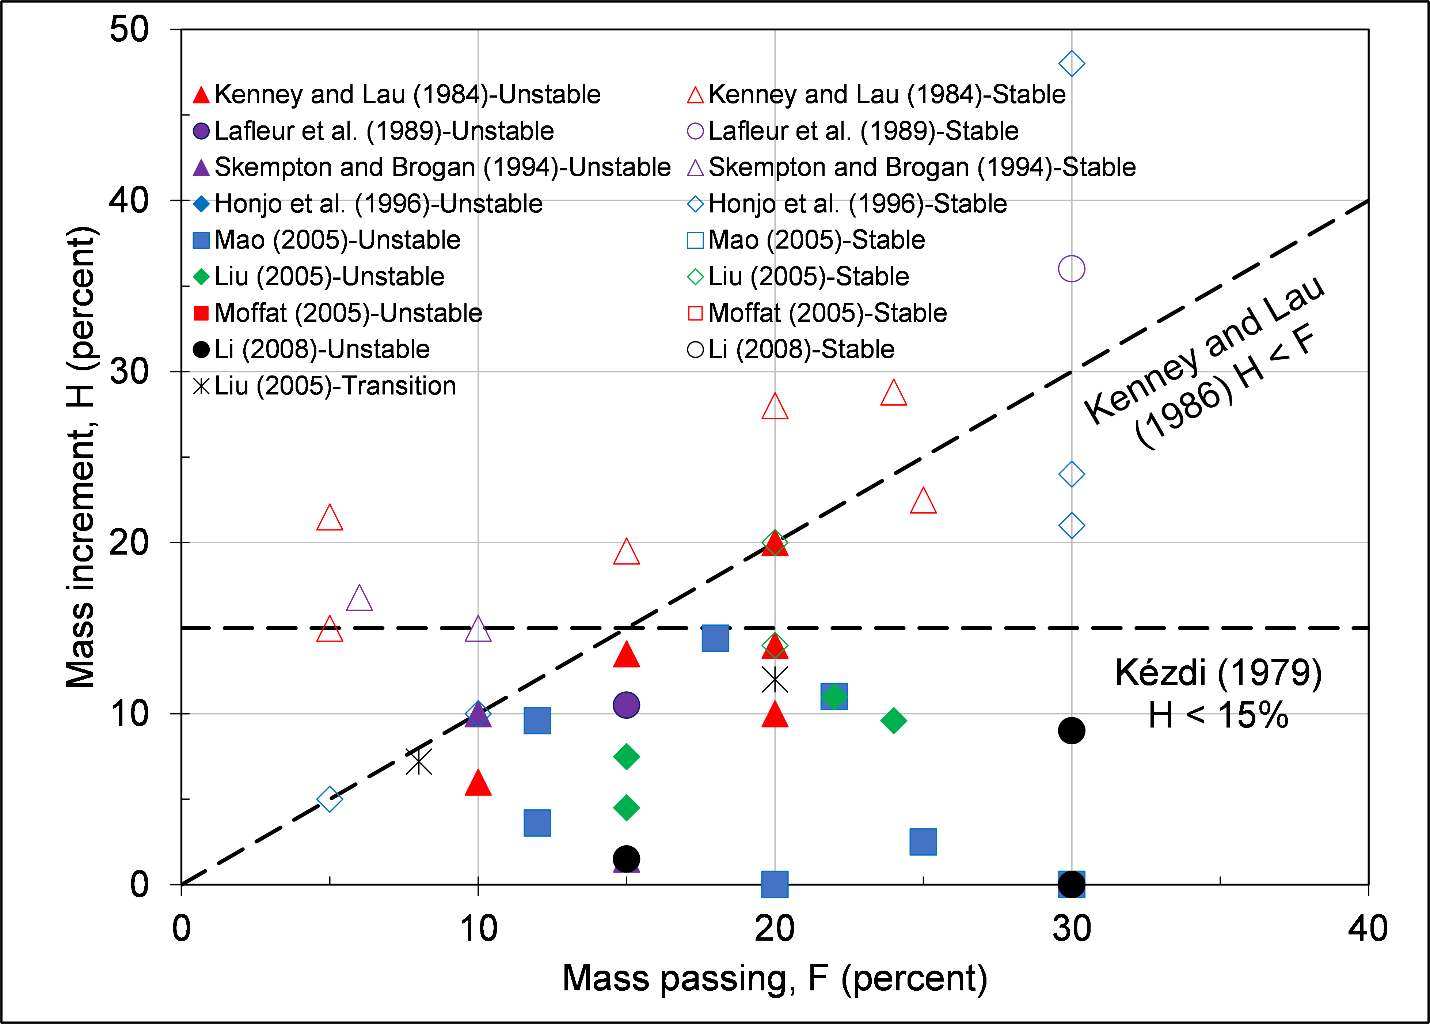
Based on a review of laboratory test results in Figure, Li and Fannin (2008) [?] concluded that the Kenney and Lau criterion of is a more precise boundary for internal instability for F less than 15 percent, and the Kezdi criterion of H = 15 percent is a more precise boundary for internal instability for F greater than 15 percent.
As a result, they proposed an approach that combined the two criteria for assessing the susceptibility to internal instability. As Figure illustrates, the resulting unstable zone is trapezoidal, bounded on the left by the Kenney and Lau criterion (), on the top by the Kezdi criterion ( percent), and on the right by percent for WG soils or percent for NG soils. If any portion of the shape curve falls within the applicable trapezoid, that fraction of the soil gradation is considered internally unstable.
This worksheet assesses the susceptibility of broadly graded and gap-graded soils using the modified Kenney and Lau method of Li and Fannin (2008) [?]. As Figure illustrates, the shape curve is obtained based on the particle-size analysis on the Gradation worksheet. These calculations are displayed at the bottom of the worksheet and are not in the print range.
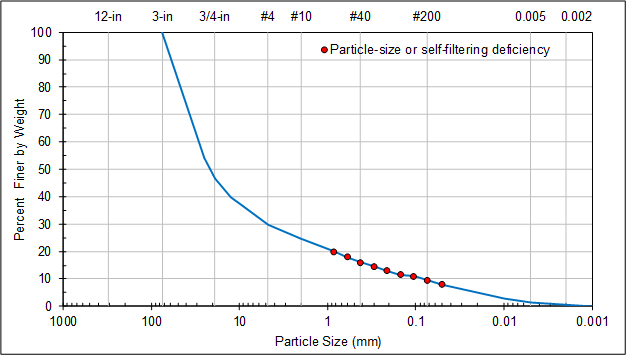
Figure, Figure, and Figure display the calculated shape curve as a blue line along with the individual (F, H) pairs. The figures display points plotting in the unstable zone as red circles, and points plotting in the stable zone as green circles. Figure illustrates an example for a widely graded soil with a calculated Cu, Figure illustrates an example for a narrowly graded soil with a calculated Cu, and Figure illustrates an example for a widely graded soil without a calculated Cu.
The minimum stability index is determined based on the calculated ratios for the individual (F,H) pairs, and the mass passing (F) where occurs is linearly interpolated from the shape curve. The coefficient of uniformity (Cu) from the Gradation worksheet is also displayed if sufficient particle-size data is available for its calculation.
To define the appropriate boundary for the unstable zone, the primary soil fabric must be characterized as widely graded or narrowly graded . Use the drop-down list to select the primary soil fabric. When it is calculated, coefficient of uniformity can directly inform the user-specified primary soil fabric; otherwise, use judgment to select the most appropriate primary soil fabric. Based on the user-specified primary soil fabric, the trapezoidal shape of the unstable soil is plotted as a black dashed line, and a description of the three applicable criteria (, percent, and either widely graded criterion of F = 20 percent for widely graded soils or narrowly graded criterion of F = 30 percent for narrowly graded soils) is displayed.
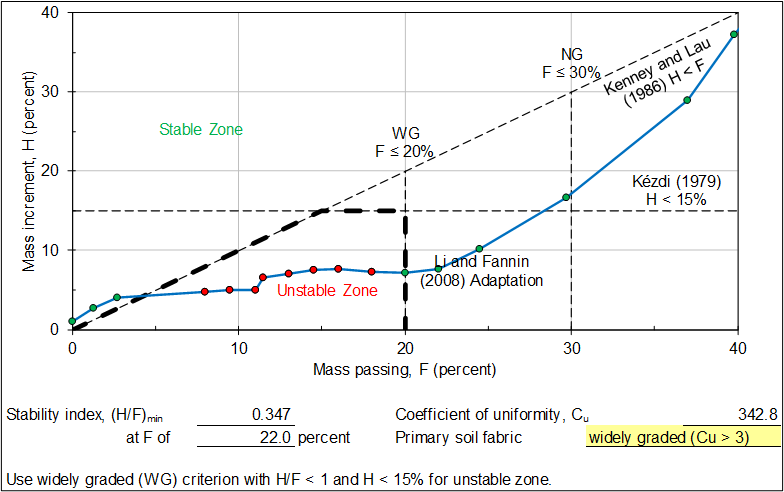
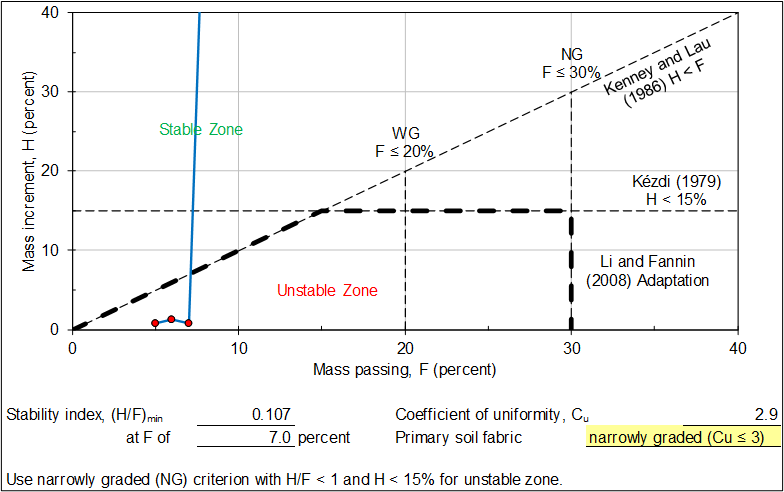
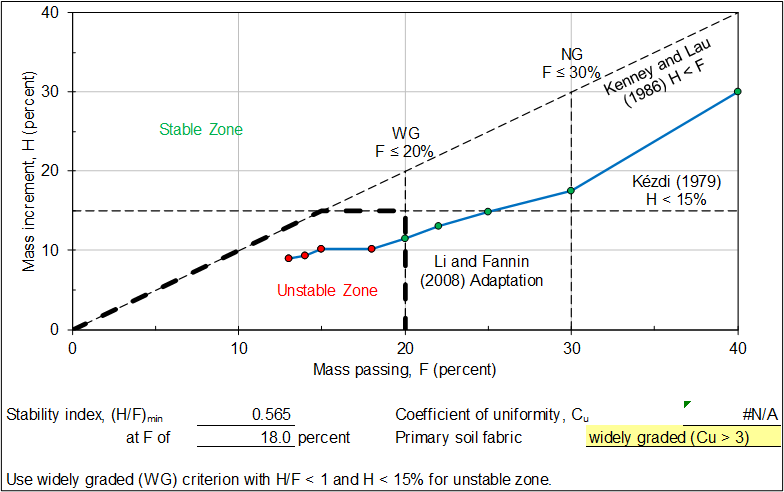
Figure illustrates an example gradation plot. The cumulative particle-size distribution is plotted as a blue solid line beneath the shape curve. Locations of particle-size deficiency (for gap-graded soils) or self-filtering deficiency (for broadly graded soils) driving the susceptibility to internal instability appear as red circles.