Alternative Method
Wan and Fell (2008) [?] determined that the methods of Kenney and Lau (1985, 1986) [?] [?] or Sherard (1979) [?] were too conservative for silt-sand-gravel and clay-silt-sand-gravel soils. Based on their experience with the modified Burenkova method, soils with a steep slope on the coarse fraction and a flat slope on the finer fraction were likely internally unstable. They developed an alternative method for broadly graded silt-sand-gravel soils using the ratios of and , where , , , and are the particle sizes corresponding to 90, 60, 20, and 5 percent finer by weight on the cumulative particle-size distribution curve, respectively.
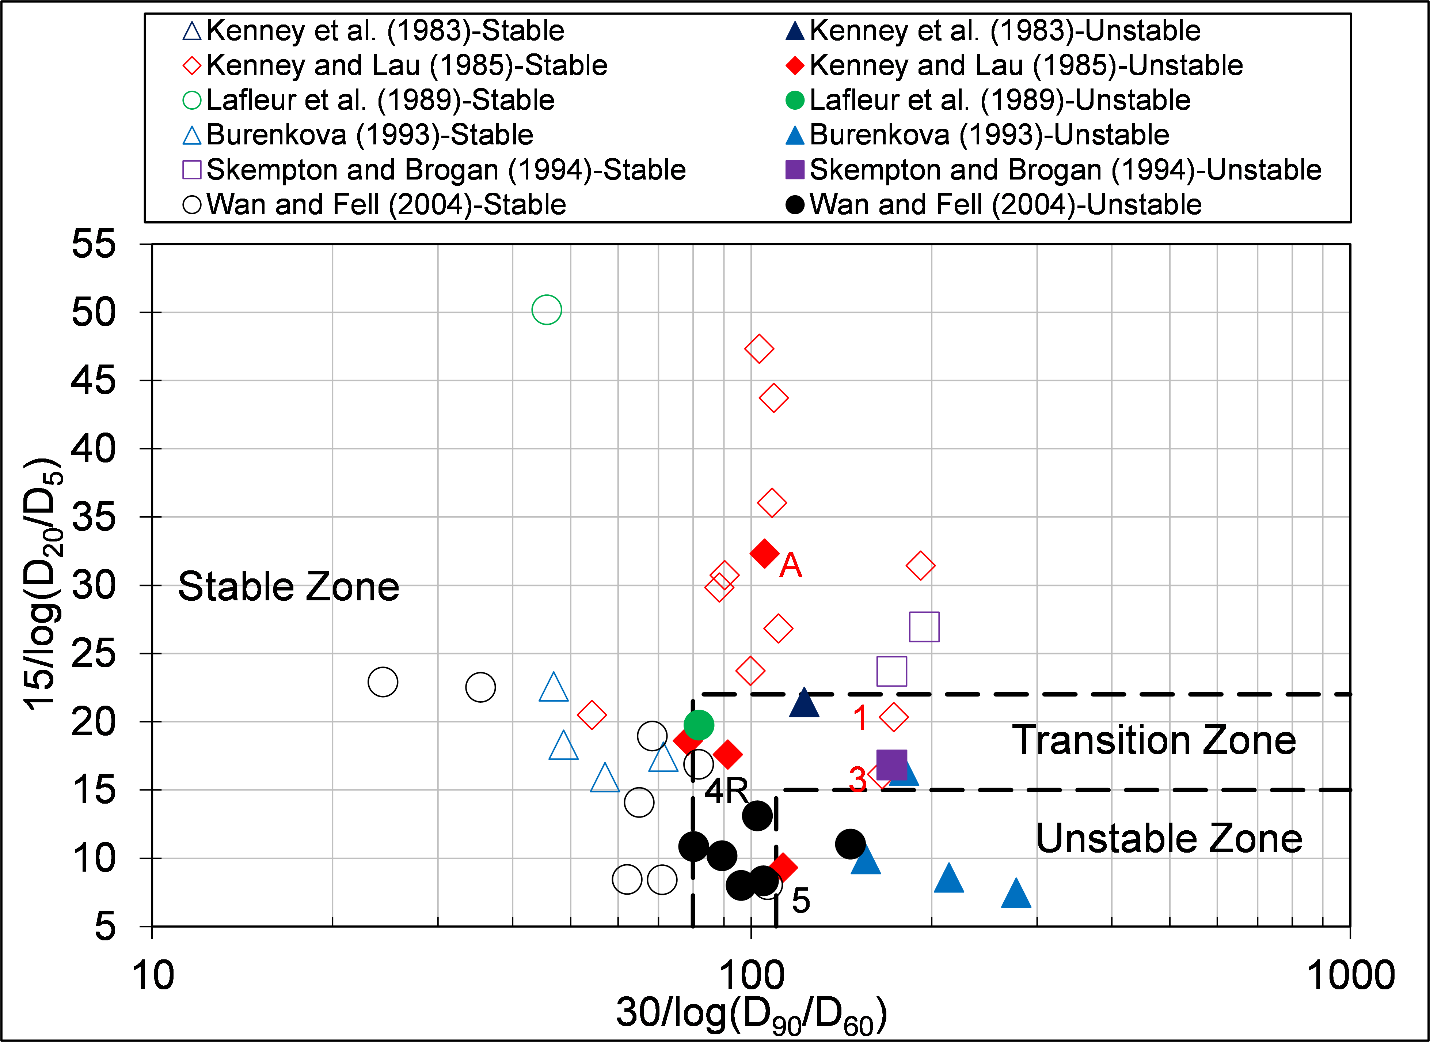
Wan and Fell (2008) [?] identified two boundaries related to internal instability, as illustrated in Figure. The first is associated with a low likelihood of internal instability (or stable zone), and the second is associated with a very high likelihood of internal instability (or unstable zone). A transition zone is between these two zones where both stable and unstable soil gradations were observed.
Applicability
This worksheet assesses the susceptibility of broadly graded silt-sand-gravel soils to internal instability using the Wan and Fell (2008) [?] alternative method. This method is not applicable to gap-graded soils, and soils that have a finer fraction less than 20 percent may not be adequately assessed by this method. While it has not been proven by tests, Wan and Fell (2008) [?] indicated if the slope of the finer fraction is used in lieu of the ratio, the method should be applicable.
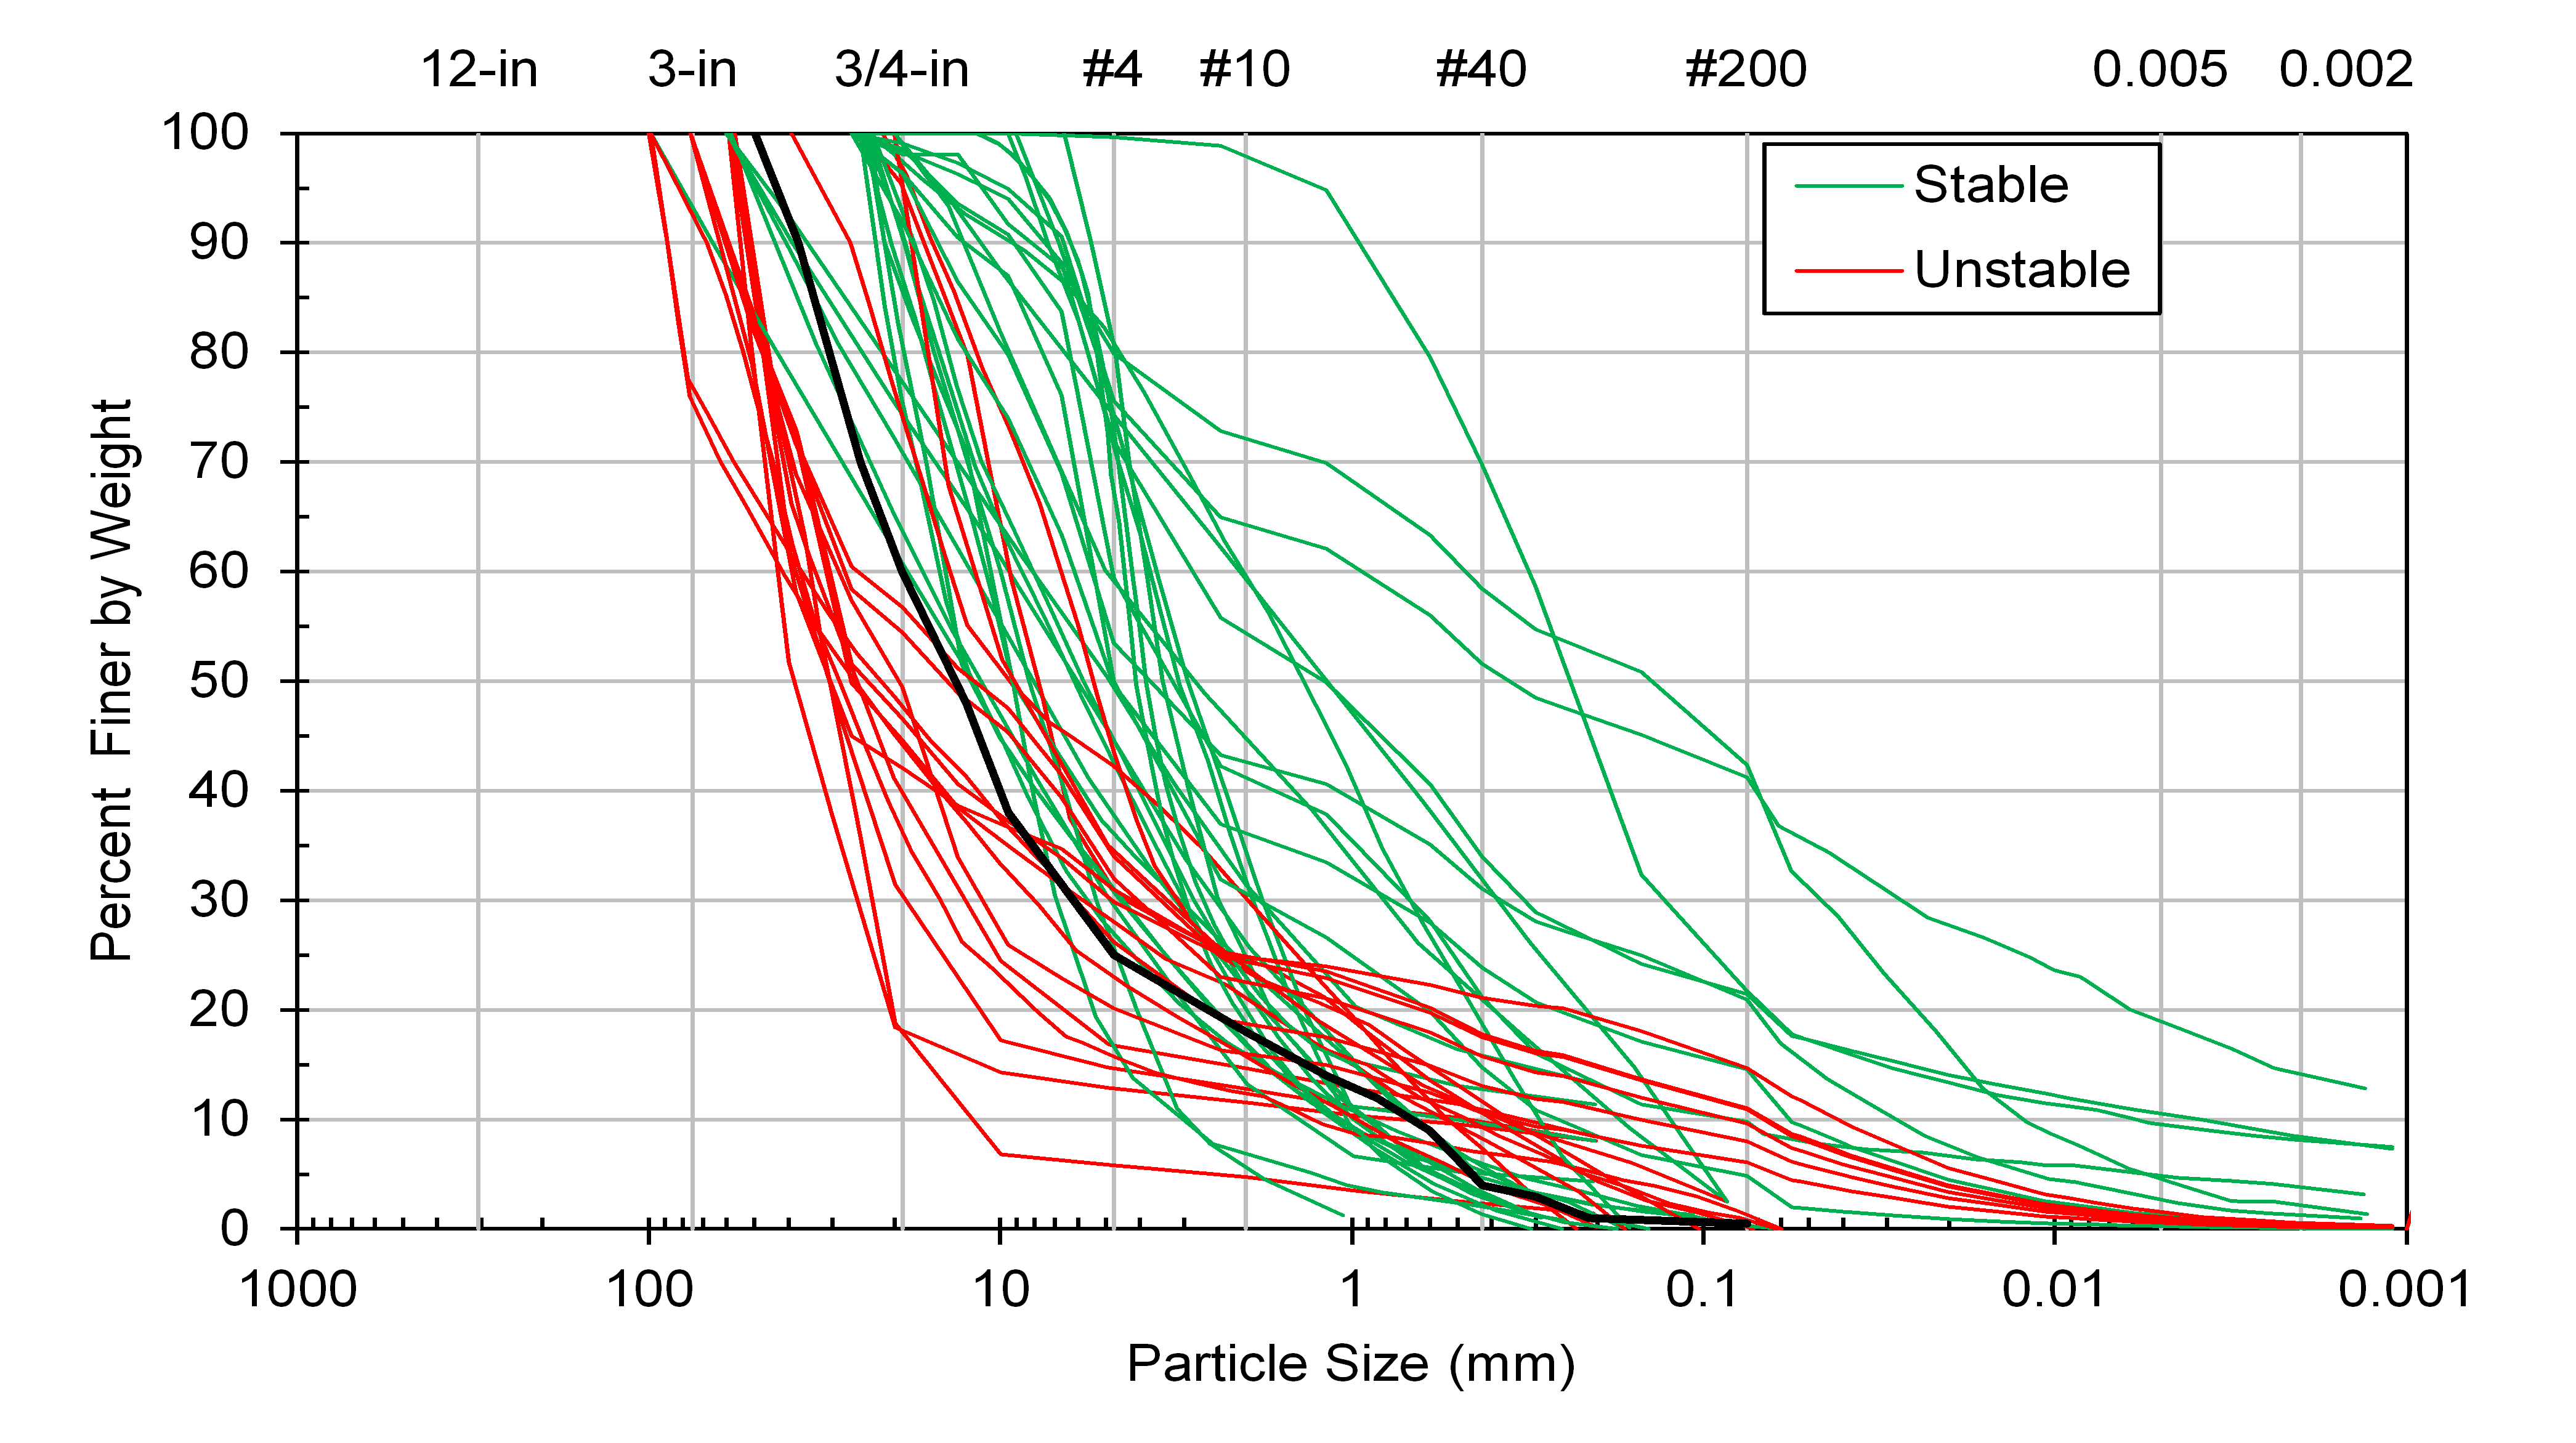
In step 1, the user-specified gradation from the Gradation worksheet is plotted as a black line against the stable gradations (green lines) and unstable gradations (red lines) used to develop the method for visual comparison, as illustrated in Figure.
Susceptibility to Internal Instability
In step 2, the susceptibility to internal instability of the user-specified gradation is assessed. Based on the particle-size analysis on the Gradation worksheet, D90, D60, D20, and D5 are interpolated using logarithmic scale for particle size and linear scale for percent finer by weight to calculate the x-axis value and y-axis value .
Figure is an example of the particle-size analysis and graphical output. The zone boundaries are plotted as black dashed lines, with red text indicating the unstable zone, green text indicating the stable zone, and black text indicating the transition zone. The evaluated soil is plotted as a blue dot which can be compared to the zones to estimate if the soil is potentially susceptible to internal instability.
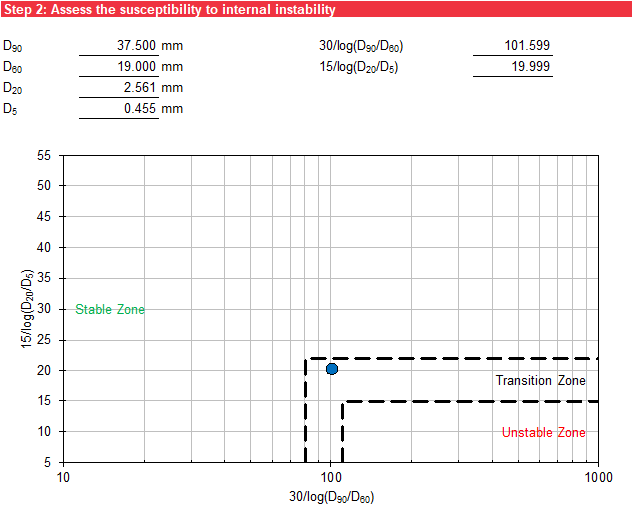
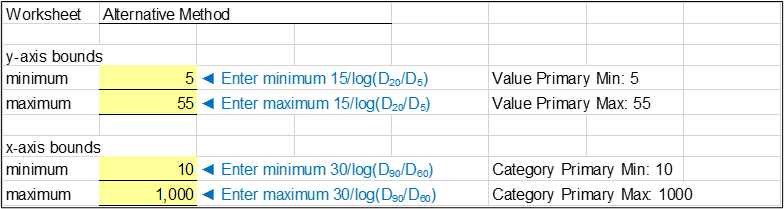
Figure shows the plot options for Figure. The minimum and maximum values for the x-axis and y-axis are user-specified.