Modified Burenkova Method
The Burenkova method [?] characterized the heterogeneity of cohesionless sand-gravel soils using two conditional factors of uniformity: h′ and h″, where D90, D60, and D15 are the particle sizes corresponding to 90, 60, and 15 percent finer by weight on the cumulative particle-size distribution curve, respectively.
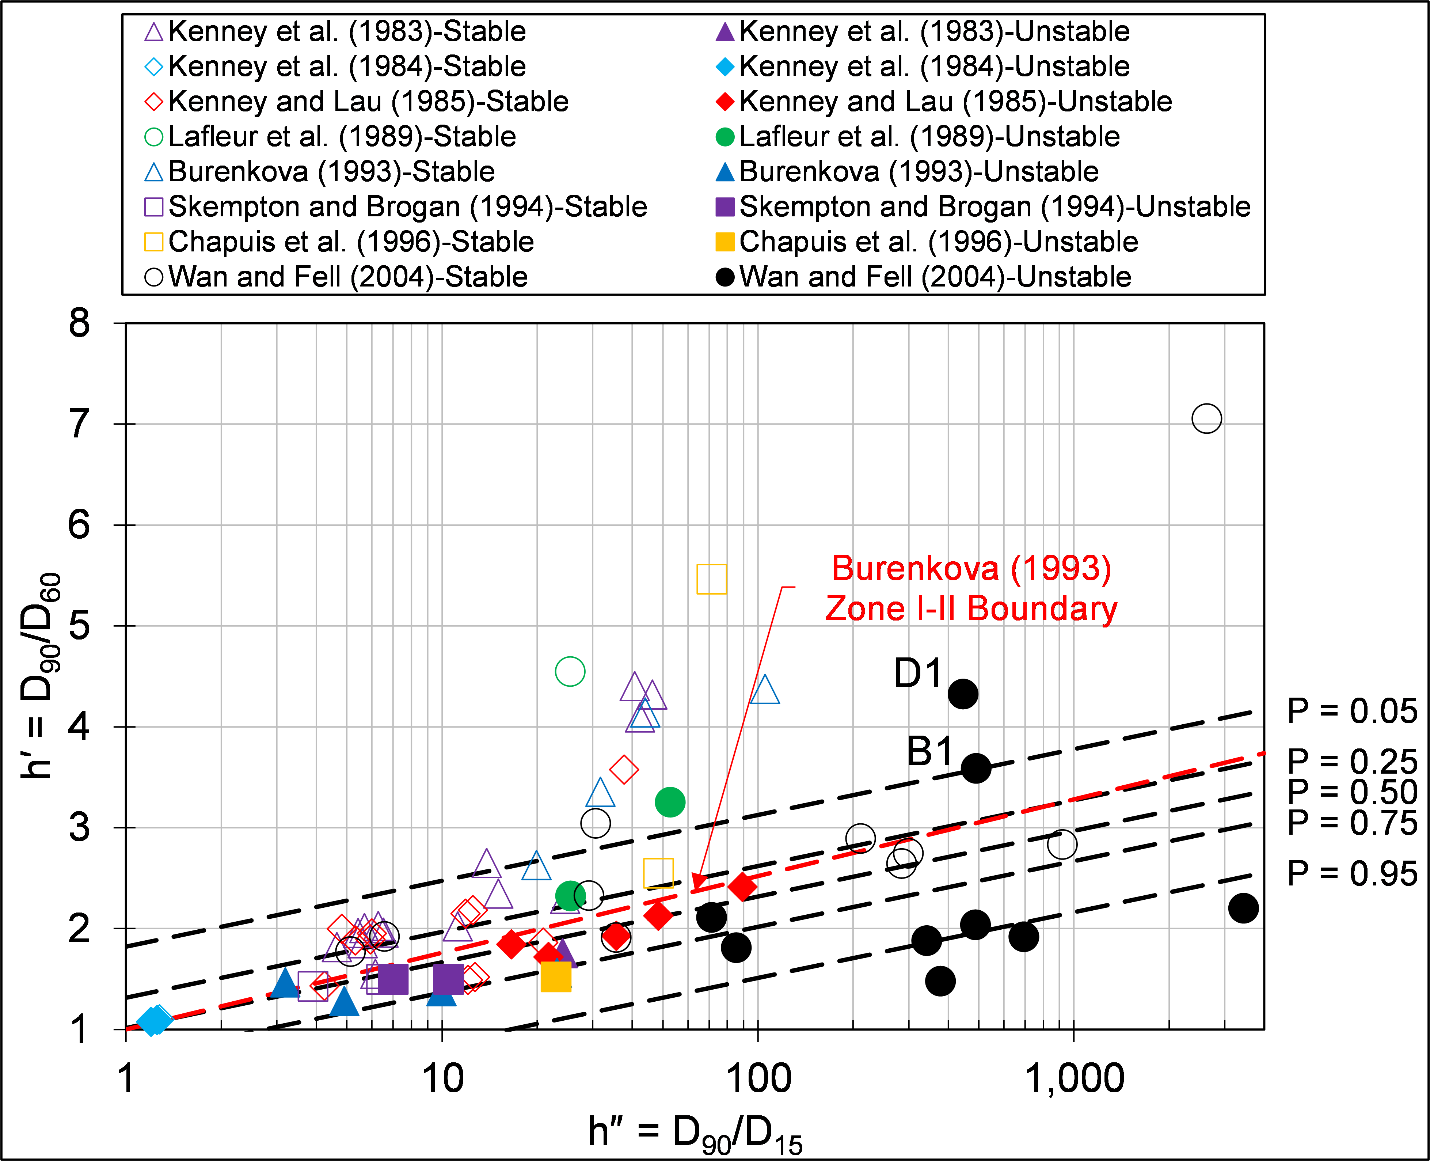
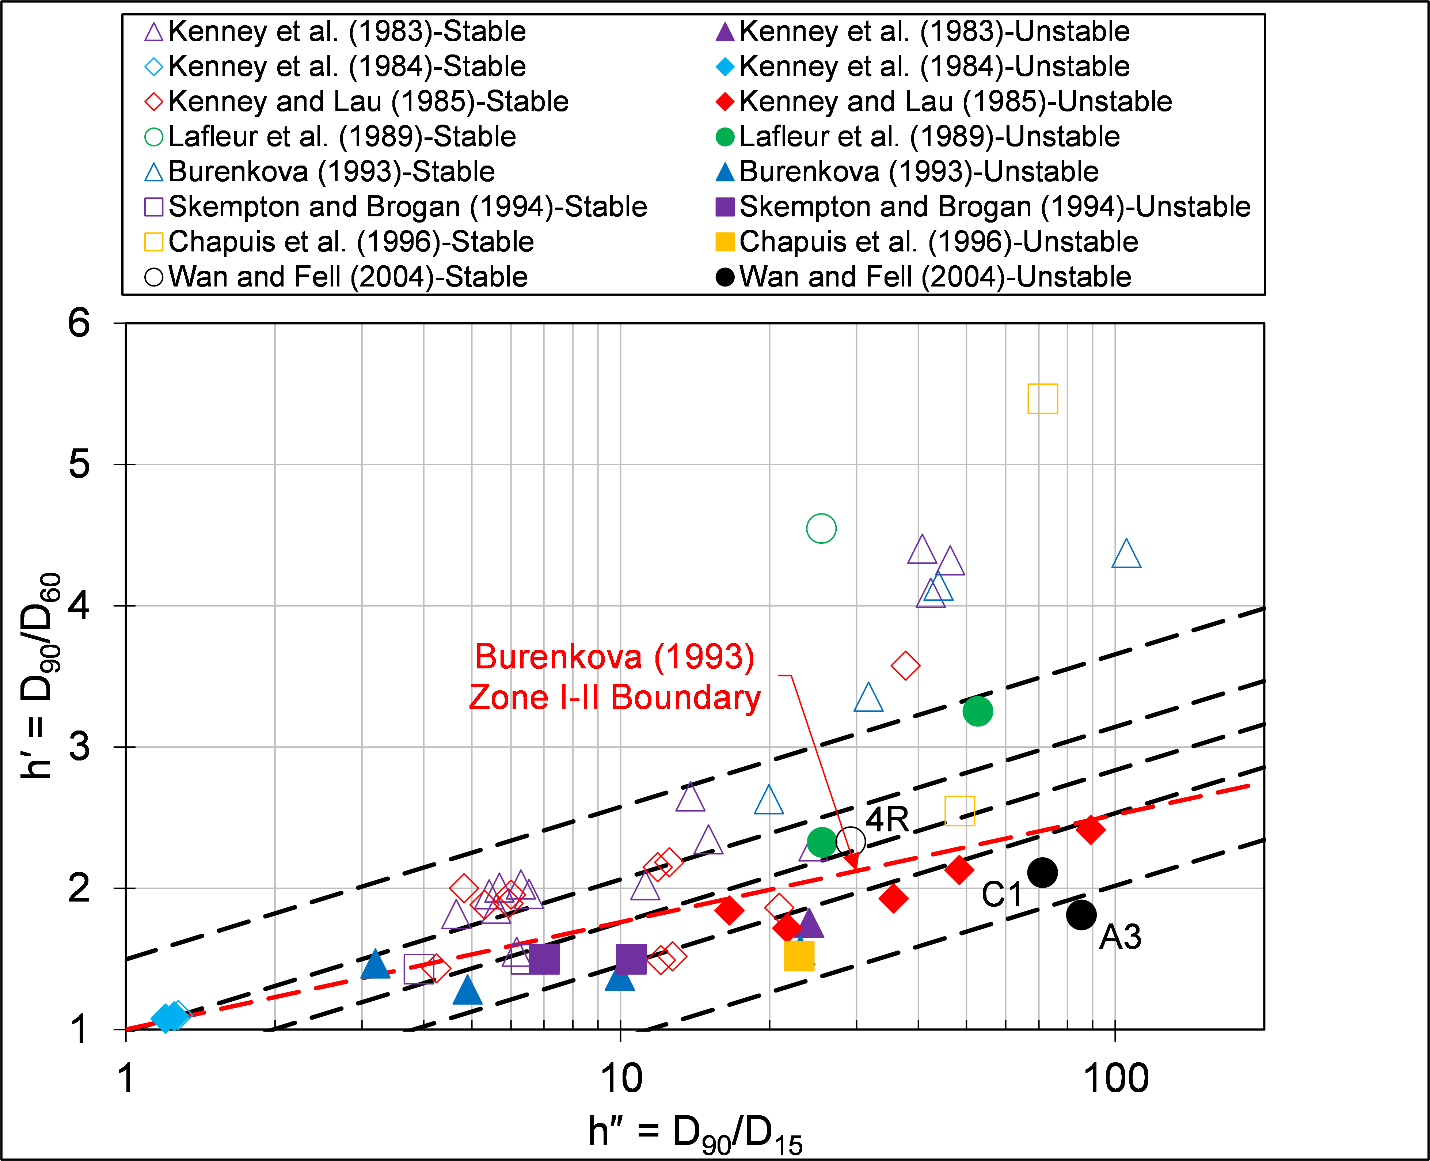
Wan and Fell (2008) [?] indicated that the Burenkova method [?] does not provide a clear boundary between internally stable and unstable soils. As illustrated in Figure and Figure, they performed logistic regression to define contours of equal probability of internal instability as a function of h′ and h″ for silt-sand-gravel and clay-silt-sand-gravel soils of limited clay content and plasticity and sand-gravel soils with less than 10 percent non-plastic fines.
Equation defines the probability contours of internally unstable soils (PIUS) or the probability of internal instability (PIUS) from the logistic regression.
where
for silt-sand-gravel soils and clay-silt-sand-gravel soils of limited clay content and plasticity, and
for sand-gravel soils with less than or equal to 10 percent non-plastic fines.
Figure illustrates Burenkova (1993) [?] had a second zone (Zone III) of suffusive soils. Wan and Fell (2004) [?] did not test soils in this range. These soils have a concave downward shape, and they indicated such soils are uncommon and are expected to be internally stable.
This worksheet assesses the susceptibility of broadly graded and gap-graded soils using the modified Burenkova method of [?]. Soils having a finer fraction of less than 15 percent may not be adequately assessed by this method.
Calculating h′ and h″ is the same as the Burenkova Method worksheet. Two options, discussed in Silt-Sand-Gravel Soils and Clay-Silt-Sand-Gravel Soils and Sand-Gravel Soils, are provided, depending on the applicable soil classification.
Silt-Sand-Gravel Soils and Clay-Silt-Sand-Gravel Soils
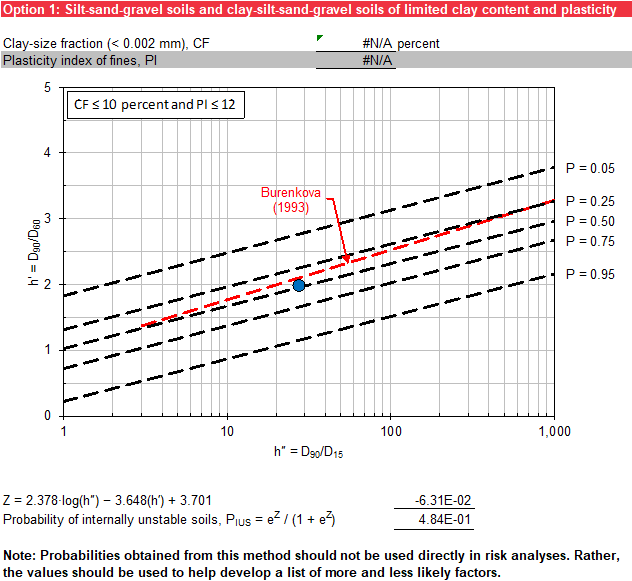
Option 1 evaluates silt-sand-gravel soils and clay-silt-sand-gravel soils of clay-size fraction (CF, finer than 0.002 millimeter) less than or equal to 10 percent and PI less than or equal to 12. Based on the particle-size analysis on the Gradation worksheet, the CF is interpolated using logarithmic scale for particle size (0.002 millimeter) and linear scale for percent finer by weight. The soil classification is also obtained from the Gradation worksheet. If Atterberg fines limits testing was performed, the PI is obtained from the Gradation worksheet. If Atterberg fines limits testing was not performed, the PI has a gray background.
Equation estimates the probability of internal instability (PIUS) by combining Equation and Equation.
Figure is an example of the output. Five logistic regression lines of probability are plotted as dashed black lines for reference (5, 25, 50, 75, and 95 percent probability of internal instability) and the soil being evaluated is plotted as a blue dot. The Burenkova [?] Zone I boundary for suffusive soils is plotted as a red dashed line for reference.
If the CF is greater than 10 percent or the PI is greater than 12, values that do not meet the criteria for the method have an orange background. If the CF cannot be interpolated or Atterberg limits testing of the fines was not performed, use judgment to determine whether the soil is of limited clay content and plasticity.
The soil being evaluated is plotted even if one or more criteria is not met or not calculated on the Gradation worksheet. Therefore, use judgment to determine if Option 1 is applicable.
The plot options are the same as the Burenkova Method worksheet.
Sand-Gravel Soils
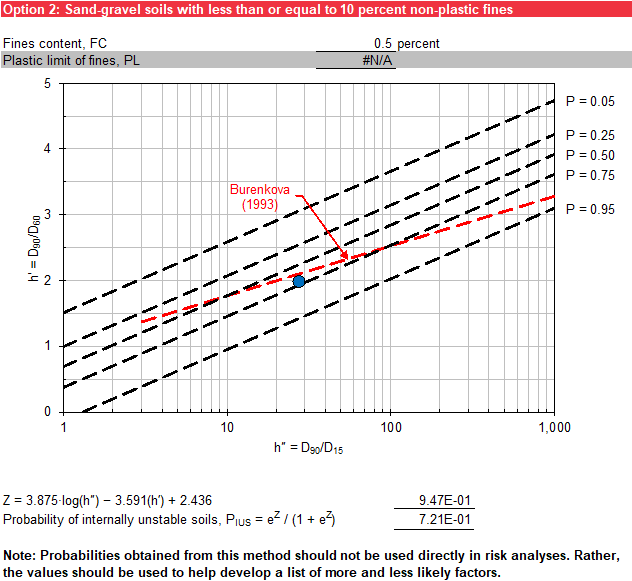
Option 2 evaluates sand-gravel soils with less than 10 percent non-plastic fines (FC, percentage finer than 0.075 millimeter). Based on the particle-size analysis on the Gradation worksheet, the FC is interpolated using logarithmic scale for particle size (0.075 millimeter) and linear scale for percent finer by weight. The soil classification is also obtained from the Gradation worksheet. If Atterberg limits testing of the fines was performed, the PL is obtained from the Gradation worksheet. If Atterberg limits testing of the fines was not performed, thePL has a gray background.
Equation combines Equations 6 and 8 to estimate the probability of internal instability (PIUS).
Figure is an example of the output. Five logistic regression lines of probability are plotted as dashed black lines for reference (5, 25, 50, 75, and 95 percent probability of internal instability), and the soil being evaluated is plotted as a blue dot. The Burenkova [?] Zone I boundary for suffusive soils is plotted as a red dashed line for reference.
If the FC is greater than 10 percent or the PL is not NP, values that do not meet the criteria for the method have an orange background. If the FC cannot be interpolated or Atterberg limits testing was not performed, use judgment to determine whether the soil has limited non-plastic fines.
The soil being evaluated is plotted even if one or more criteria is not met or not calculated on the Gradation worksheet, so use judgment to determine if Option 2 applies. The plot options are the same as the Burenkova Method worksheet.