Gradation
This worksheet analyzes particle sizes of the soil being evaluated for susceptibility to internal instability. The particle-size analysis is performed according to the Unified Soil Classification System (USCS) per American Society for Testing and Materials (ASTM) D2487 [?].
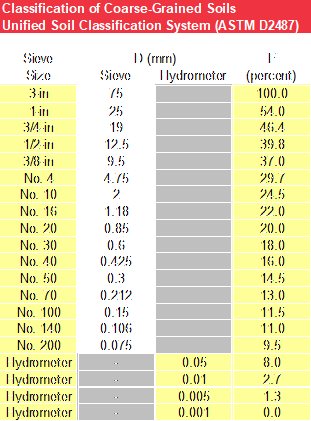
The input includes sieve size (inches or sieve number), particle size (millimeters) for hydrometer analysis, and percent finer (by weight).
Use the drop-down list to select the sieve sizes that define soil gradation. Coarse sieve designations range from 12 inches to 0.25 inches, and standard sieve designations range from No. 4 to No. 200. The particle size (D) in millimeters automatically populates with a sieve size selection. If a hydrometer (sedimentation) analysis was performed on the fine-grained portion of the soil (passing the No. 200 sieve), select “Hydrometer” from the drop-down list for sieve size and input particle sizes. Particle sizes from sieve or hydrometer analysis must be in descending order.
The user-specified percent finer (by weight) for the soil gradation (F) is the percentage of material passing each sieve size or percentage of particles finer than the diameter given by Stokes’ Law for hydrometer analysis. The input must be a decimal number, consisting of a whole number and a fractional part (for example, 100.0 for 100.0 percent passing, 25.5 for 25.5 percent passing). Cells that do not apply or do not require user-specified input have a gray background. Figure is an example of gradation input.
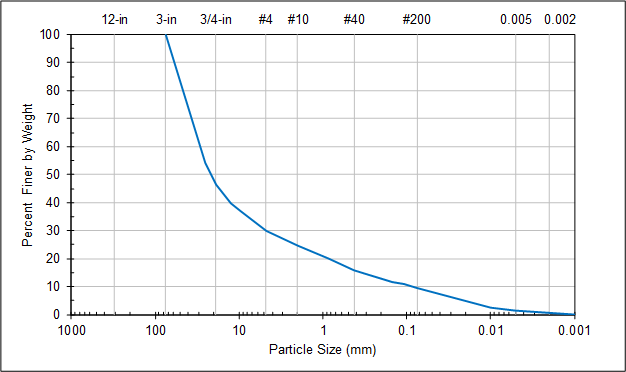
A particle-size plot is generated from the user-specified input with particle size (millimeters) on the x-axis and percent finer by weight on the y-axis. In Figure, vertical grid lines correspond to the particle size boundaries for boulders, cobbles, coarse gravel, fine gravel, coarse sand, medium sand, fine sand, and clay or silt.
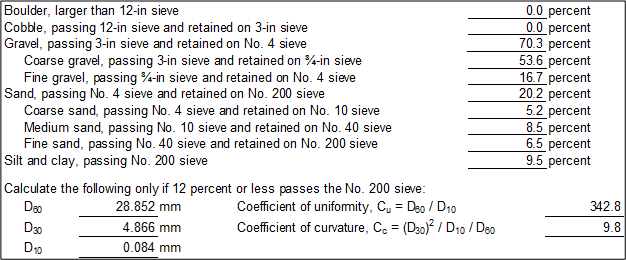
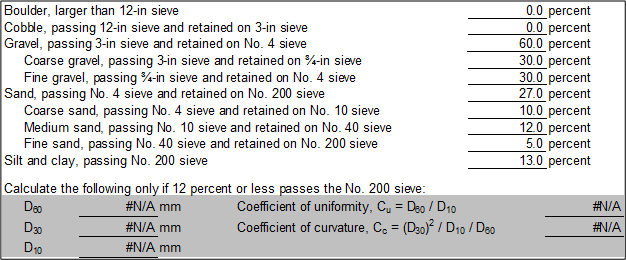
The end of the worksheet summarizes the particle-size analysis for the user-specified gradation, as illustrated in Figure and Figure. The boulder percentage (larger than 12-inch sieve), cobble percentage (passing 12-inch sieve and retained on 3-inch sieve), gravel percentage (including coarse and fine gravel), sand percentage (including coarse, medium, and fine sand), and fines content (FC) (including estimated silt and clay percentages) are calculated. If 12 percent or less of the soil passes the No. 200 sieve, the D60 , D30, D10, coefficient of uniformity (Cu), and coefficient of curvature (Cc) are calculated per ASTM D2487, as illustrated in Figure. If greater than 12 percent of the soil passes the No. 200 sieve, these calculations are not performed, and cells that do not apply have a gray background, as illustrated in Figure.
Equation calculates the coefficient of uniformity.
where:
D10 = particle-size diameter corresponding to 10 percent passing on the cumulative particle-size distribution curve
D60 = particle-size diameter corresponding to 60 percent passing on the cumulative particle-size distribution curve
Equation calculates the coefficient of curvature.
where:
D30 = particle-size diameter corresponding to 30 percent passing on the cumulative particle-size distribution curve
Following the particle-size analysis, characterize the fines using the results of Atterberg limits testing [?] or visual-manual fines classification [?]. Use the drop-down list to specify if Atterberg limits testing was performed on the fines.
-
If Yes, the liquid limit (LL), plastic limit (PL), and liquid limit (oven-dried) are user-specified input, as illustrated in Figure. Calculate the plasticity index (PI) as LL – PL. If the results of Atterberg limits testing show the fines are non-plastic, enter a value of NP for the PL, as illustrated in Figure.
-
If No, use the drop-down list to specify the visual-manual fines classification according to ASTM D2488 [?]. Three options are available for soil classification using visual-manual procedures: ML or MH, CL-ML, and CL or CH. Cells that do not apply have a gray background, as illustrated in Figure through Figure.
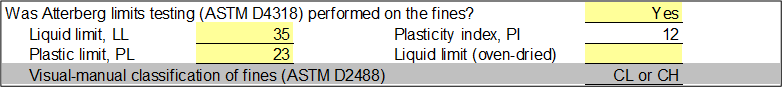
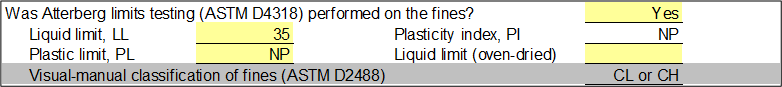
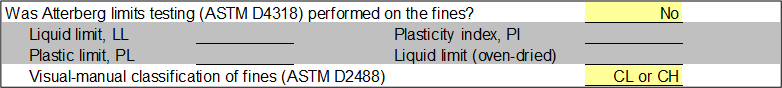
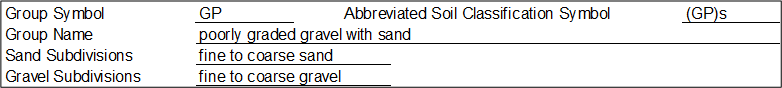
Figure illustrates the soil classification according to the USCS, and the group symbol, corresponding group name, and abbreviated soil classification symbol are provided. More information about the particle size range of the sand (based on the calculated fine, medium, and coarse sand contents) and gravel particles (based on calculated fine and coarse gravel contents) is also provided under Sand Subdivisions and Gravel Subdivisions, respectively.