Burenkova Method
Based on three representative soil fractions (D90, D60, and D15), Burenkova (1993) [?] characterized the heterogeneity of cohesionless sand-gravel soils, with maximum particle sizes up to 100 millimeters and coefficients of uniformity up to 200, using two conditional factors of uniformity (h′ and h″), as shown in Equation and Equation.
where:
D90 = particle size corresponding to 90 percent finer by weight on the cumulative particle-size distribution curve
D60 = particle-size diameter corresponding to 60 percent passing on the cumulative particle-size distribution curve
D15 = particle-size diameter corresponding to 15 percent passing on the cumulative particle-size distribution curve
According to Wan and Fell (2008) [?], the value of h′ represents the slope of the coarse part of the particle-size distribution plot, with high values of h′ representing near single-size coarse particles having large constriction spaces compared to a well-graded soil. The value of h″ is a measure of the filter action between the coarse fraction and the finer fraction.
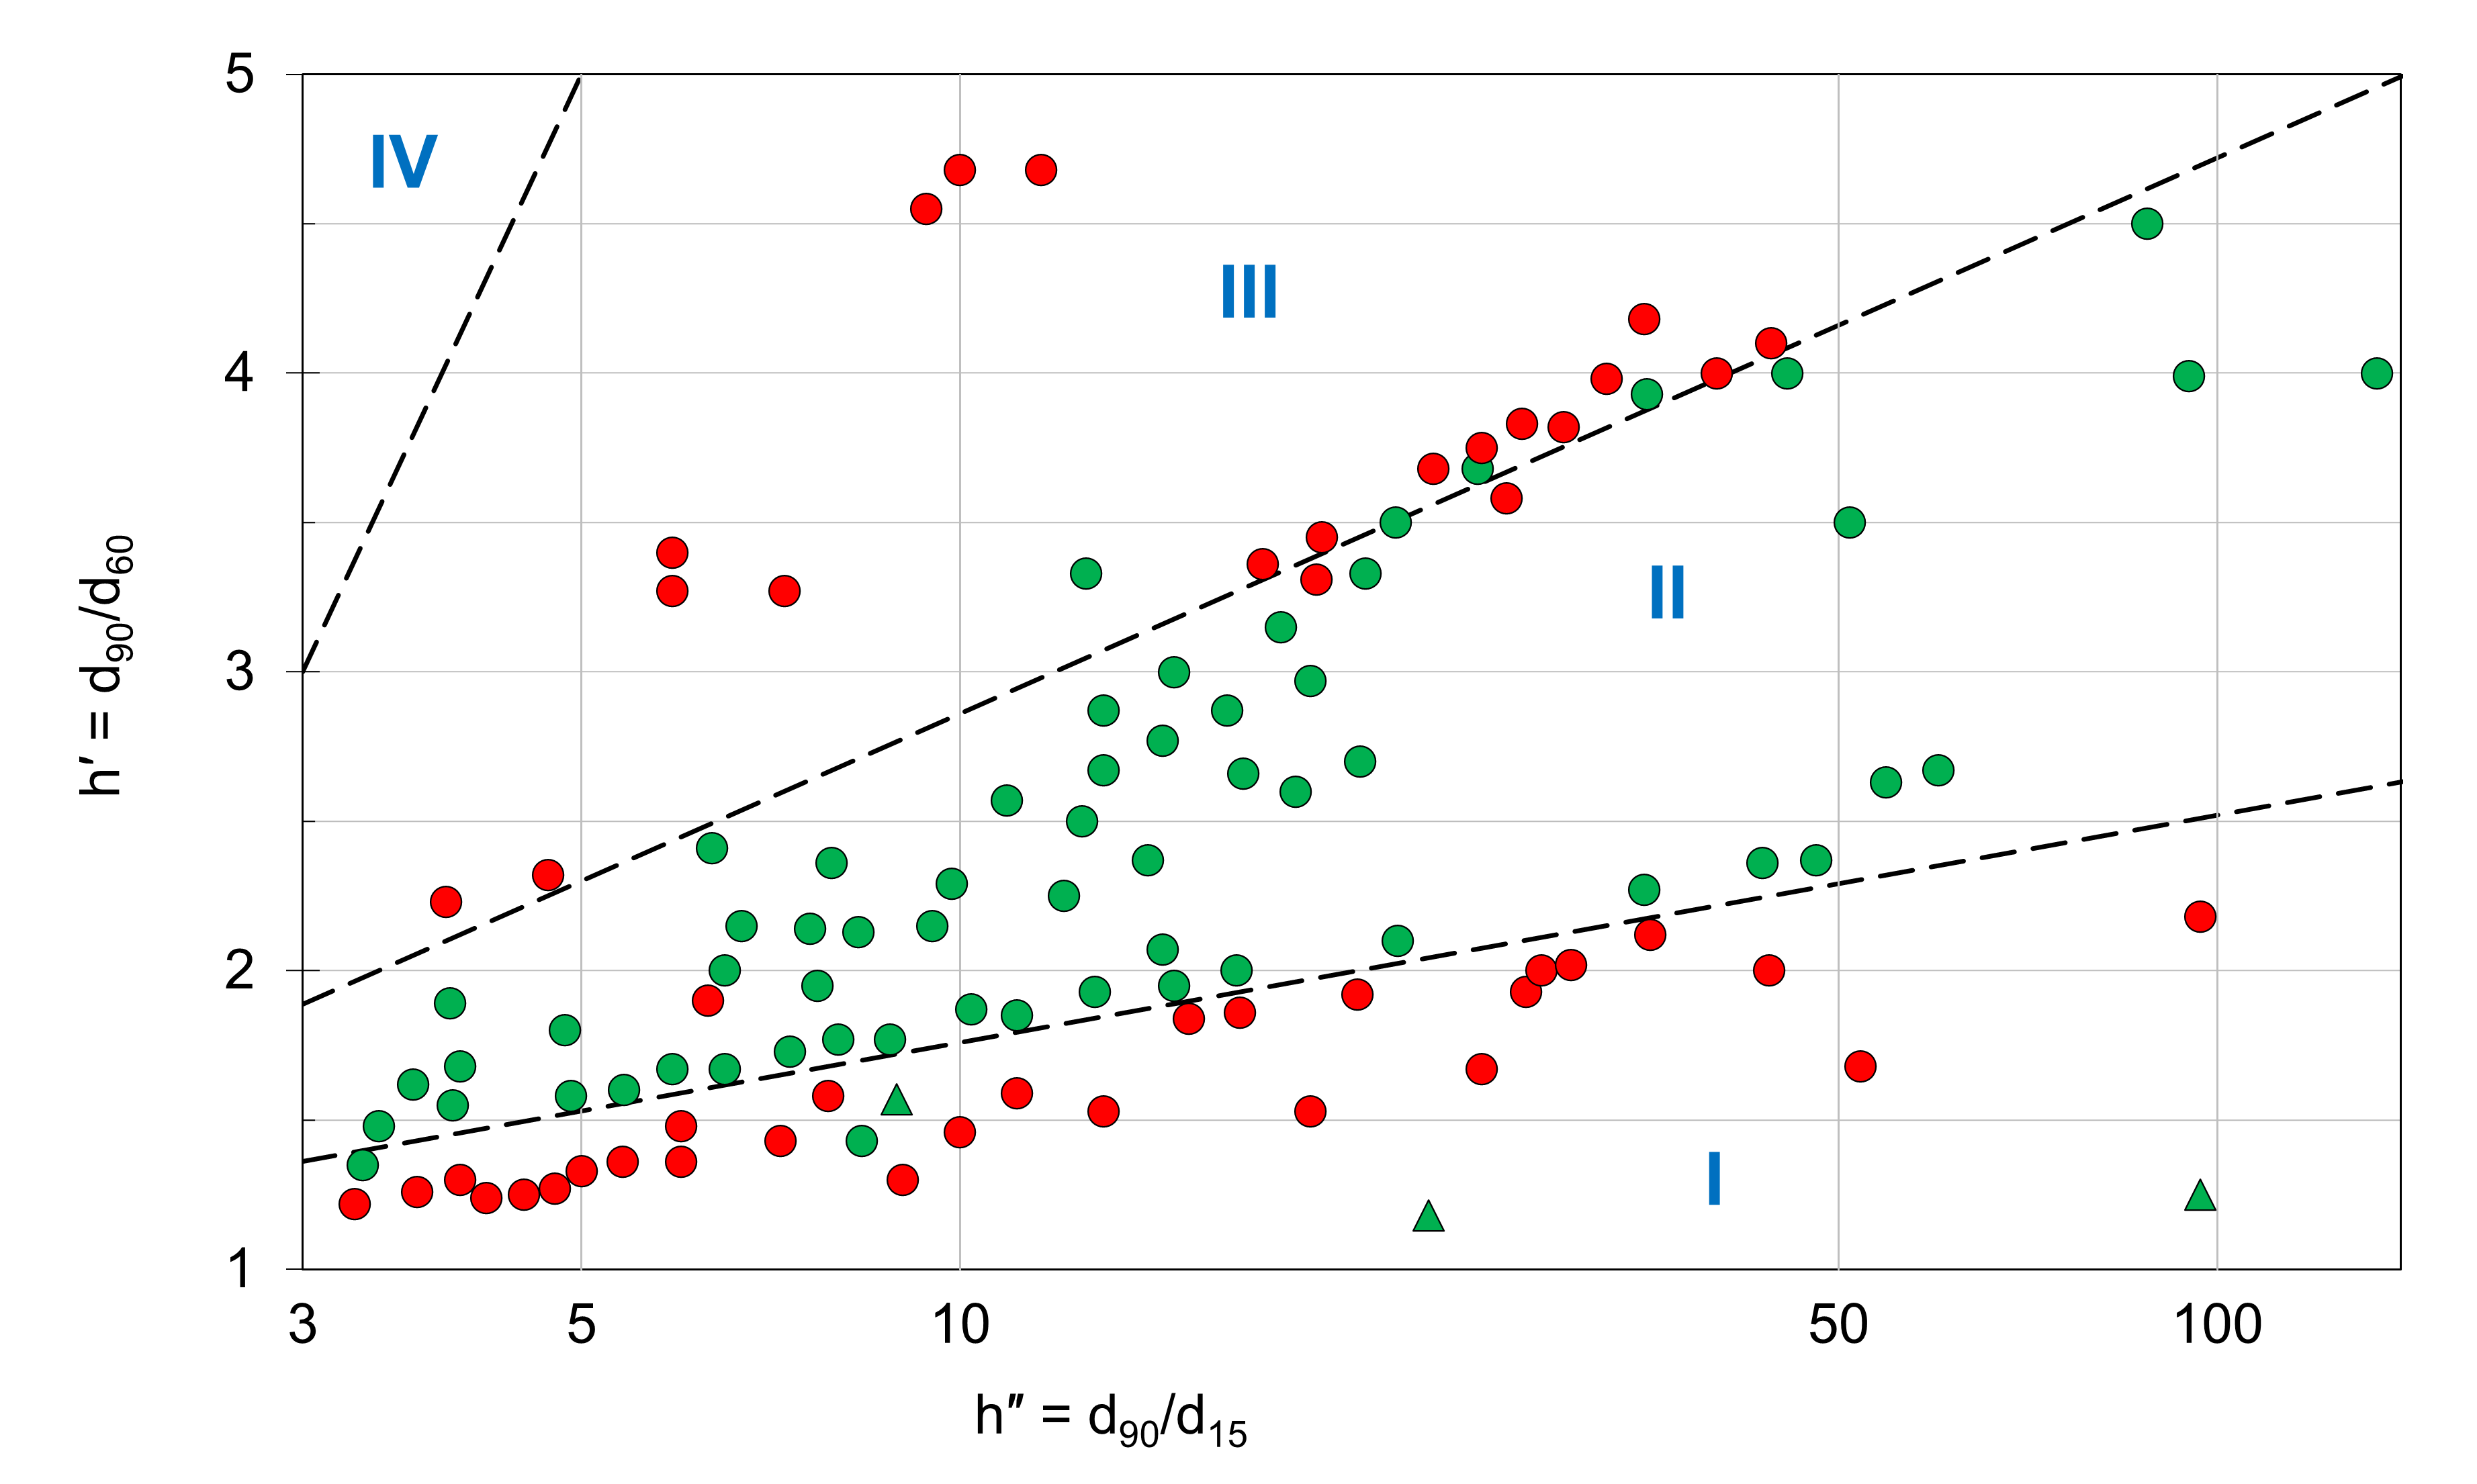
Figure illustrates laboratory test results plotted on a semi-logarithmic diagram and divided into four zones, with Zones I and III representing zones of suffusive soils, Zone II representing a zone of non-suffusive soils, and Zone IV representing a zone of artificial soils. The domain of the Zone II (non-suffusive soils) was approximated by the following inequalities defining the Zone II boundaries, as shown in Equation.
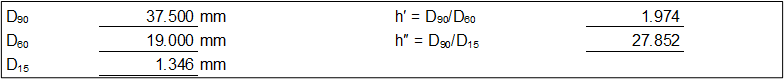
Based on the particle-size analysis on the Gradation worksheet, D90, D60, and D15 are interpolated using logarithmic scale for particle size and linear scale for percent finer by weight to calculate the values of h′ and h″. Figure illustrates an example of the particle-size analysis.
The results are plotted at the end of the worksheet. Figure illustrates an example of the output. The Zone II boundaries are plotted as black dashed lines. Red text indicates the suffusive Zones I and III, and green text indicates the non-suffusive Zone II. The evaluated soil is plotted as a blue dot.
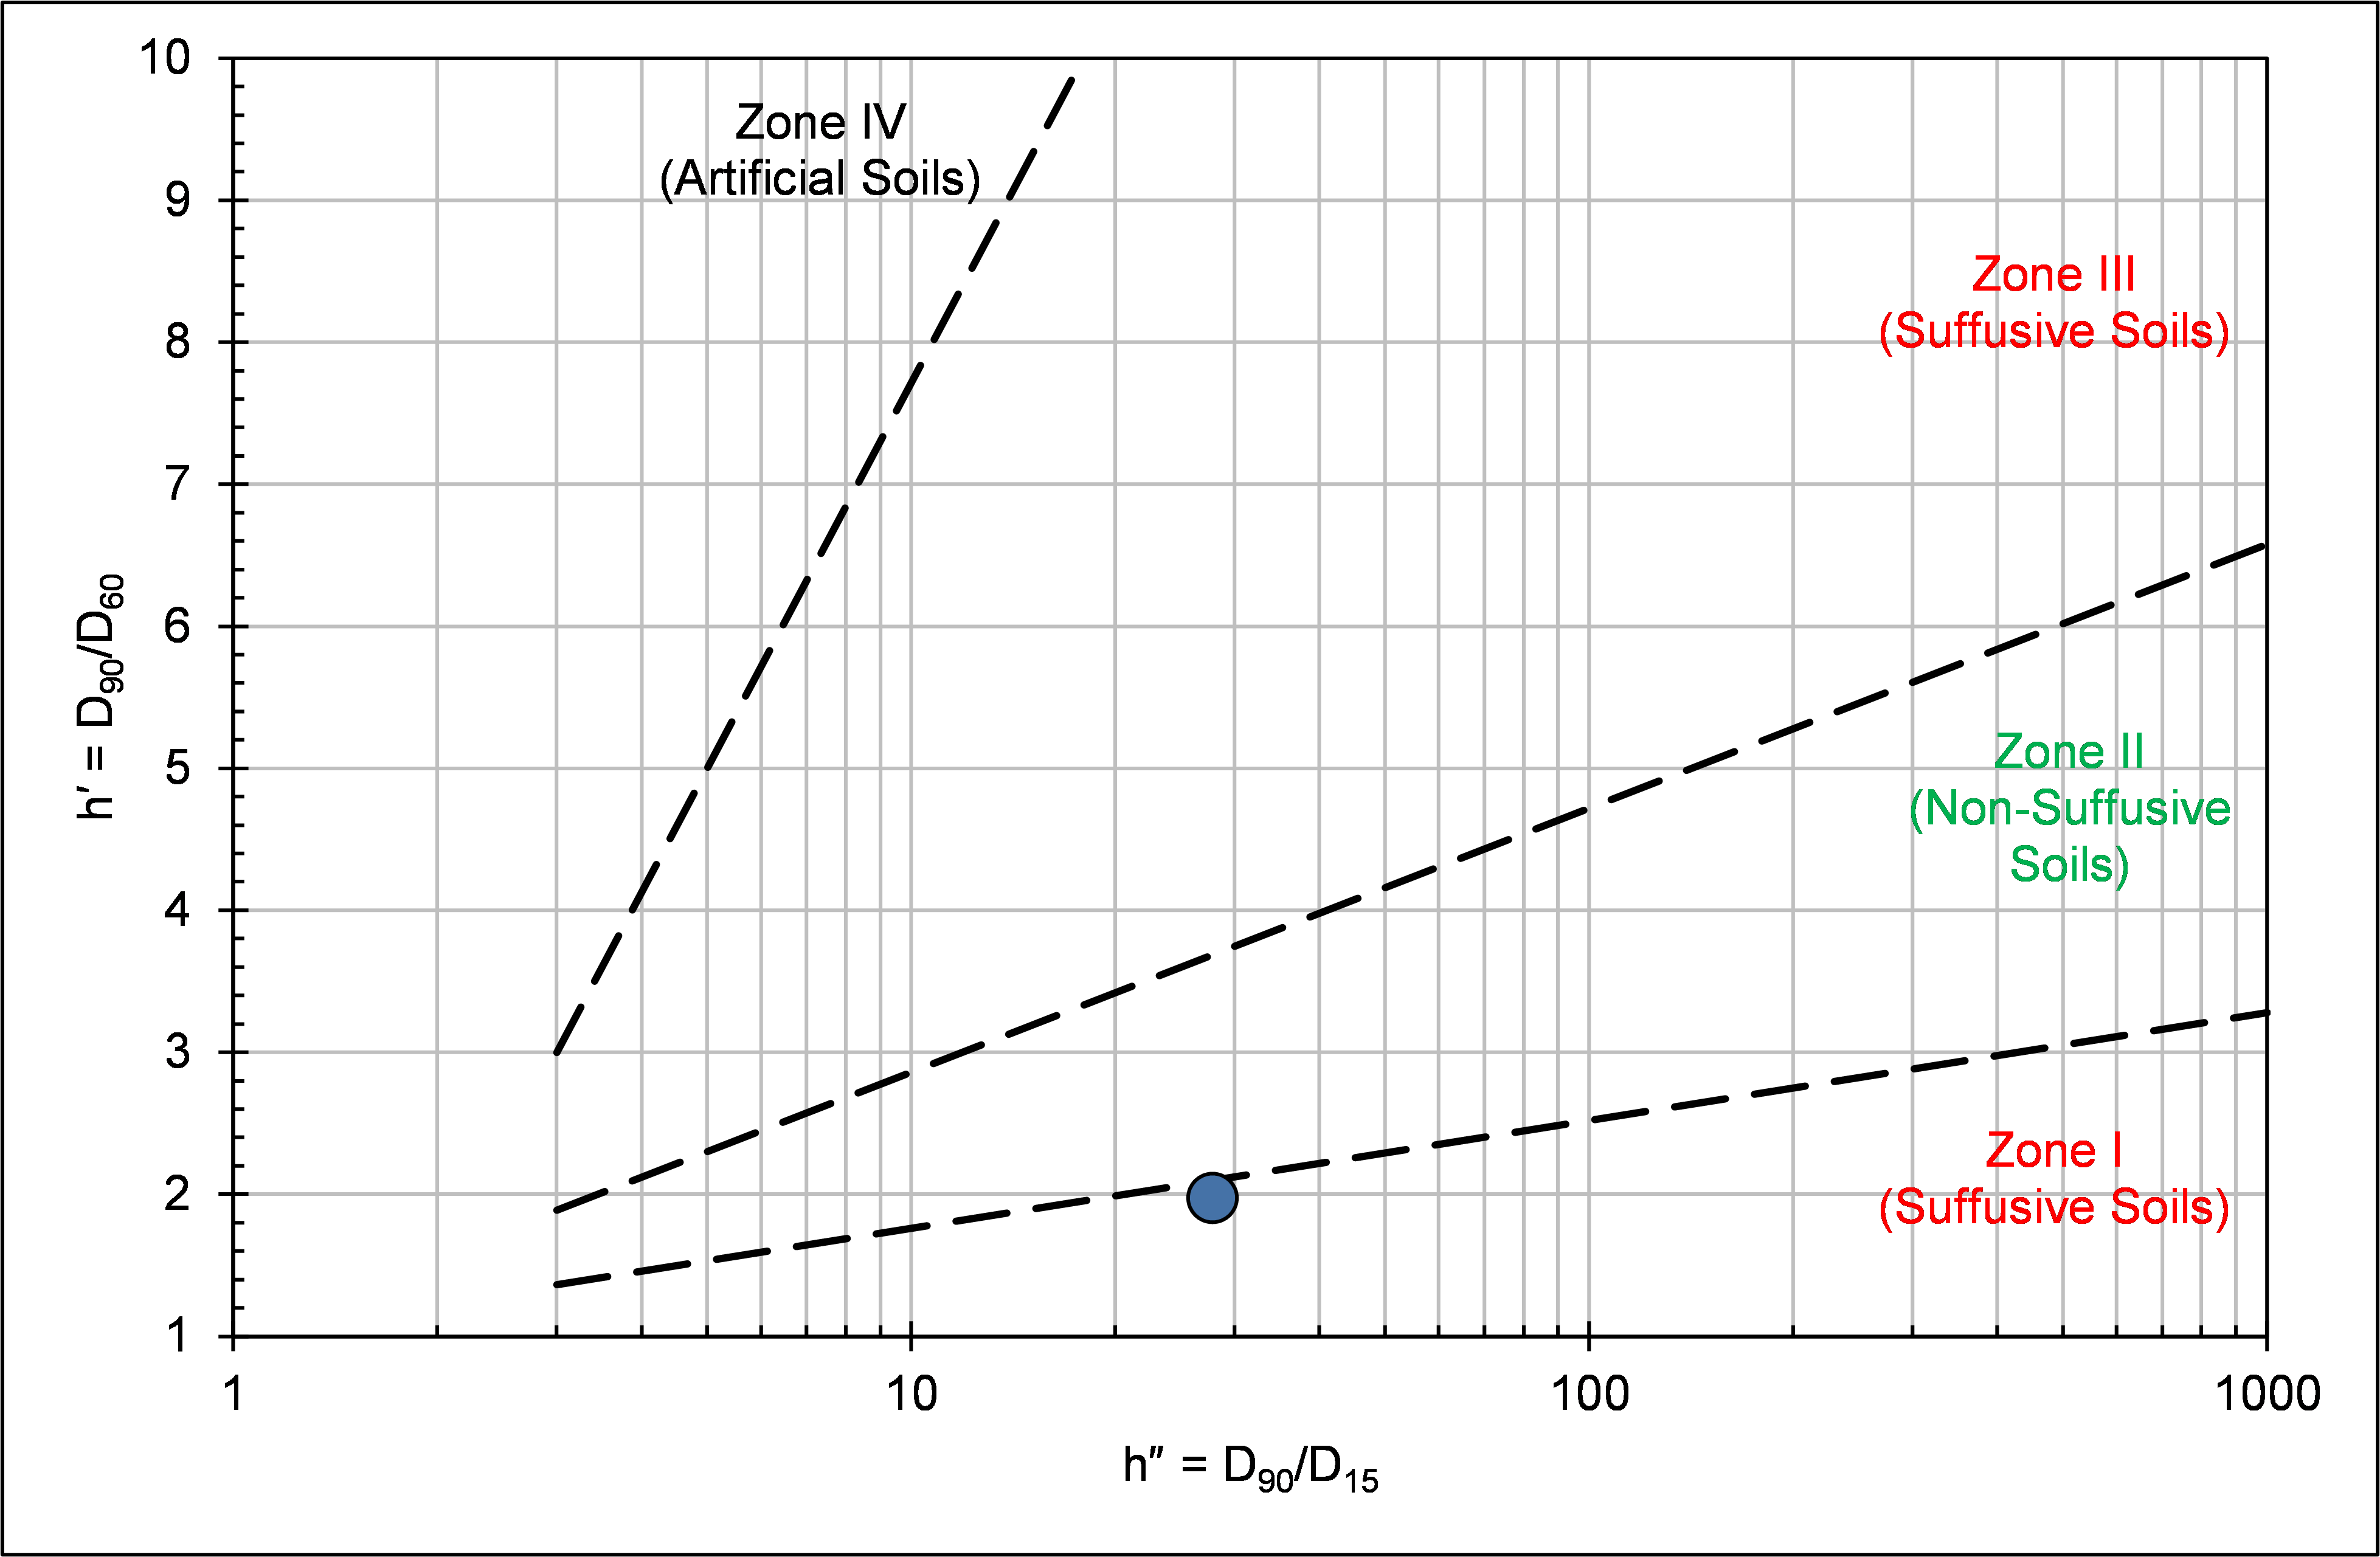
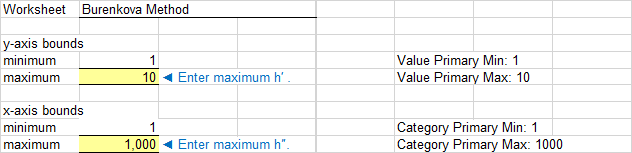
Figure shows the plot options for Figure. The maximum values for the x-axis (h″) and y-axis (h′) are user-specified.