2 Risk Analysis Framework
In RMC-TotalRisk, a risk analysis computes the risk associated with a collection of potential failure modes for each system component. A failure mode consists of three key inputs: a hazard, the system’s response to the hazard, and the consequences of that response. A non-failure mode, on the other hand, includes the hazard and the associated non-failure consequences.
A risk analysis uses four types of functions as inputs:
Hazard Function: Commonly called a frequency curve, this function describes the exceedance probabilities of various hazard levels. Examples include annual maximum peak flow frequency, peak reservoir pool stage frequency, and peak ground acceleration.
Transform Function: This function converts hazard levels from one type to another. For example, a peak flow-frequency function can be transformed into a stage-frequency function using a flow-to-stage rating curve. Transform functions are optional.
System Response Function: Often referred to as a fragility curve, this function defines the conditional probability of failure for various hazard levels, such as water surface elevations (WSEs). The system response function specifies the failure mode.
Consequence Function: Sometimes called a damage function, this function describes the consequences of failure or non-failure for various hazard levels, such as annual maximum peak WSEs.
For example, Figure 2.1 illustrates the conceptual risk analysis process for a levee with a single failure mode and a single system component. Beginning in the top left of the figure, the flood hazard is defined by an annual maximum peak flow-frequency distribution, estimated using flood-frequency analysis methods. Next, moving to the top right, peak flow is transformed to a WSE using a stage-discharge rating curve estimated using a hydraulic model. Then, moving to the bottom right, the system response function is defined by a probability of failure given the WSE, often derived from engineering analysis and expert elicitation methods. And finally, moving to the bottom left, the consequences given failure are estimated as a function of WSE.
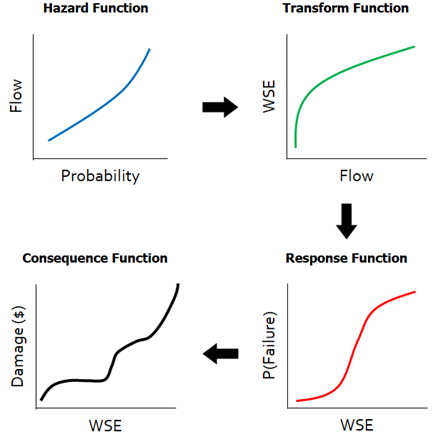
Figure 2.1: Levee risk analysis process for a single failure mode and a single system component.
The risk analysis computes the expected annual consequences by integrating over these functions. For a deeper understanding of the mathematics involved in risk analysis, refer to the technical reference manual [1]. Additional USACE guidance on risk analysis for flood risk management is in [2] and [3].
This user guide demonstrates how to create a project; enter hazard, transform, response, and consequence functions; create a risk diagram, perform a risk analysis, and review results.