Probability Tables
This worksheet estimates the probability of initiation of concentrated leak erosion using the probability tables from Fell et al. (2008) [?]. See section S5.4.2.4 of Fell et al. (2008) [?] for the assumptions of the Monte Carlo analyses used to develop the probability tables. For this simplified approach, tailwater is assumed to be below the base of the crack, gap, or pipe, and horizontal cracks cannot be evaluated.
Flaw and Embankment Core Characterization
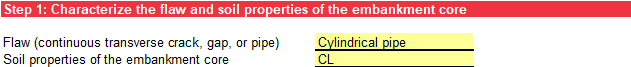
In step 1, use the drop-down lists to select the flaw type and soil properties in the embankment core as shown in Figure . The flaw types that can be evaluated are cylindrical pipe, vertical rectangular crack, and vertical triangular crack. The soil properties that best describe the embankment core are based on Fell et al. (2008) [?].
Core Geometry and Initial Pipe or Crack Dimensions
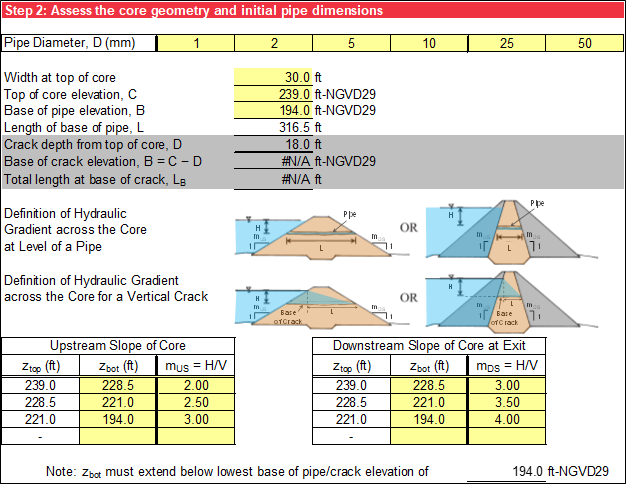
In step 2, input pipe diameters or crack widths to evaluate, width at top of core, top of core elevation, and slope data for the embankment core. Input (in ascending order) up to six different pipe diameters or crack widths to evaluate. When evaluating a vertical rectangular crack or a vertical triangular crack, the crack width refers to the maximum width at the top of the core. Slopes are defined by elevation, starting at the top of the core and ending at the base of the embankment. Step 3 uses the slopes of the embankment core to calculate the pipe or crack length over which the hydraulic head difference occurs. Therefore, the lowest core elevation (minimum zbot) must be less than or equal to the base of pipe or crack elevation to compute the length. A caution displays with an orange background if the minimum user-specified zbot for the upstream or downstream slope of the core is greater than base of pipe elevation.
Input the base of pipe elevation if the selected flaw is cylindrical pipe. The length of base of pipe is calculated using the core geometry and the base of pipe elevation. If the selected flaw is a vertical rectangular crack or a vertical triangular crack, this input and calculation have a gray background. Figure illustrates the geometric input for a cylindrical pipe.
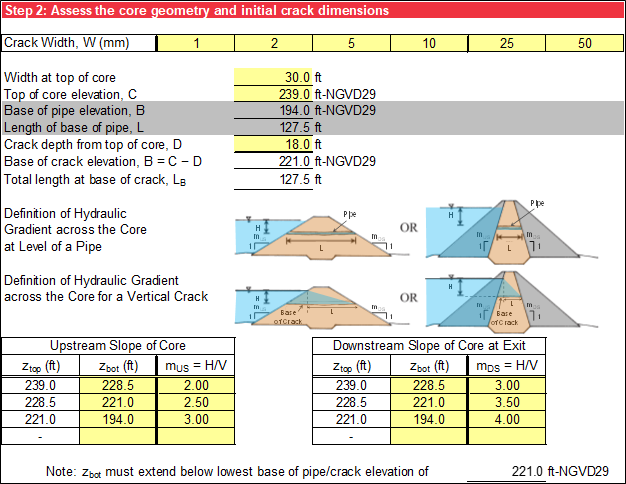
Input the crack depth from the top of the core if the selected flaw is a vertical rectangular crack or a vertical triangular crack. The base of crack elevation is calculated by subtracting the crack depth from the top of core elevation. The total length at the base of the crack is calculated using the core geometry and the base of crack elevation. If the selected flaw is a cylindrical pipe, this input and calculations have a gray background. Figure illustrates the geometric input for a vertical rectangular crack or a vertical triangular crack.
Hydraulic Gradient in the Pipe or Crack
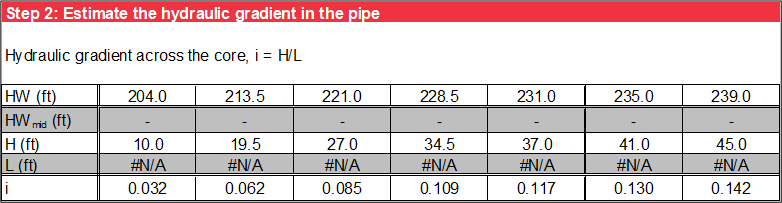
Step 3 calculates the average hydraulic gradient in the pipe or crack by dividing the hydraulic head above the base of the pipe or crack by the equivalent length of the pipe or crack. The length used in the calculation of the average hydraulic gradient across the core is the length of crack over which the net hydraulic head occurs and is referred to as the equivalent length.
For a cylindrical pipe, the equivalent length is the full distance along the base of the pipe calculated in step 2. Since it is not a function of the embankment geometry, the calculated length as a function of headwater level displays a gray background. For a homogenous embankment, the pipe length is measured at the base elevation of the pipe as a straight line from the upstream slope of the embankment to the downstream slope. For a zoned embankment where the upstream and downstream zones are very permeable (e.g., rockfill), the pipe length is measured as a straight line at the base elevation of the pipe from the upstream slope of the impervious core to the downstream slope of the impervious core. Override the formula for pipe length with a user-specified length for embankments with sloping cores, pipe orientations that are not perpendicular to the embankment centerline, etc.
Figure illustrates the average hydraulic gradient calculations for a cylindrical pipe.
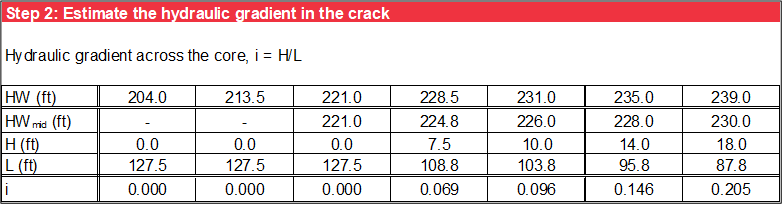
For a vertical rectangular crack or a vertical triangular crack, the equivalent length is measured from the downstream face of the core at the base of the crack to a projection of the point where the headwater level intersects the upstream face of the core. Figure illustrates both hydraulic conditions for homogeneous embankments and zoned embankments where the upstream and downstream zones are very permeable (e.g., rockfill). Override the formula for equivalent length with a user-specified length for embankments with sloping cores, crack orientations that are not perpendicular to the embankment centerline, etc. The headwater level at the midpoint of the flow path under consideration (HWmid), which occurs at H/2, is also calculated for a vertical rectangular crack and a vertical triangular crack.
HWmid
displays a gray background if the selected flaw is a cylindrical pipe. Figure illustrates the average hydraulic gradient calculations for a vertical rectangular crack or a vertical triangular crack.
Likelihood of Initiation of Concentrated Leak Erosion
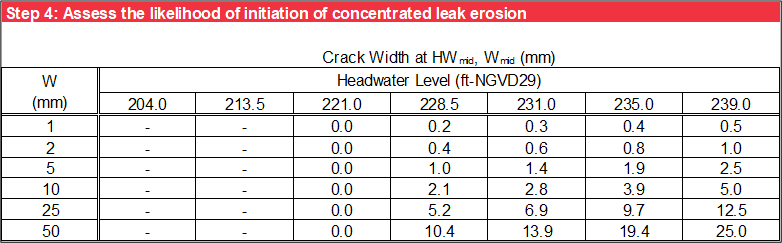
Step 4 calculates the crack width at HWmid (Wmid) for a vertical rectangular crack or a vertical triangular crack, as shown in Figure. Wmid for a vertical rectangular crack is the same as the crack width at the top of the core. This table is not used for cylindrical pipes, and if the selected flaw is a cylindrical pipe, a gray background displays.
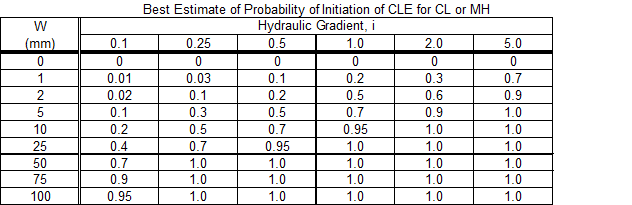
The second table in step 4 is from Fell et al. (2008) [?] and is based on the user-specified soil properties of the embankment core in step 1. It provides the best estimate of the probability of initiation of concentrated leak erosion as a function of hydraulic gradient and pipe diameter or crack width. For vertical triangular cracks, the crack width in this table is Wmid. Figure illustrates an example of one of these tables for an embankment core characterized using the Unified Soil Classification (USCS) group symbol of CL (lean clay).
The third table in step 4 calculates the best estimate of the probability of initiation of concentrated leak erosion as a function of the user-specified pipe diameter or crack width at the top of the core and headwater level, by performing two-way linear interpolation using the second table. The results are plotted as a function of pipe diameter or crack width at the top of the core and headwater level, as in Figure.
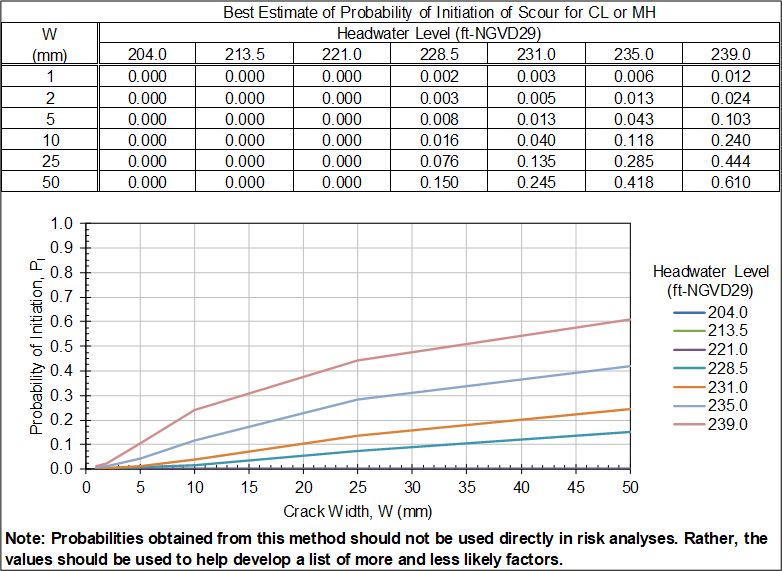
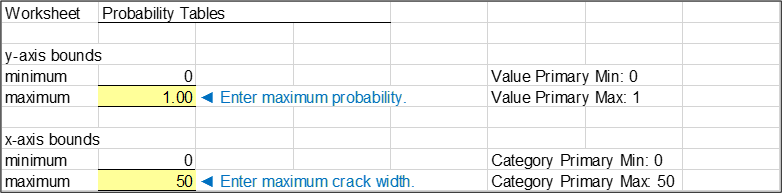
Figure illustrates the plot options for Figure. The maximum value for the y-axis (probability of initiation of concentrated leak erosion) and maximum value for the x-axis (pipe diameter or maximum crack width at the top of the core) are user-specified.
Likelihood of Initiation of Concentrated Leak Erosion Considering Uncertainty
Fell et al. (2008) [?] also developed lower bound and upper bound probability estimates to quantify the uncertainty. The first and second tables in step 5 provide probabilities of initiation of concentrated leak erosion as a function of hydraulic gradient and pipe diameter or crack width for the lower bound estimate and upper bound estimate, respectively. These tables are also based on the soil properties of the embankment core in step 1. The third and fourth tables calculate the lower bound and upper bound estimates of the probabilities of initiation of concentrated leak erosion, as a function of the user-specified pipe diameter or crack width at the top of the core and headwater level, by performing two-way linear interpolation using the first and second tables, respectively. These four tables are like those shown in step 4.
Use the drop-down list to select the pipe diameter or crack width at the top of the core for plotting the uncertainty bounds. The best, lower bound, and upper bound estimates of probabilities of initiation of concentrated leak erosion are plotted as a function of headwater level for the user-specified pipe diameter or crack width at the top of the core. Figure illustrates the graphical summary of the probability estimates.
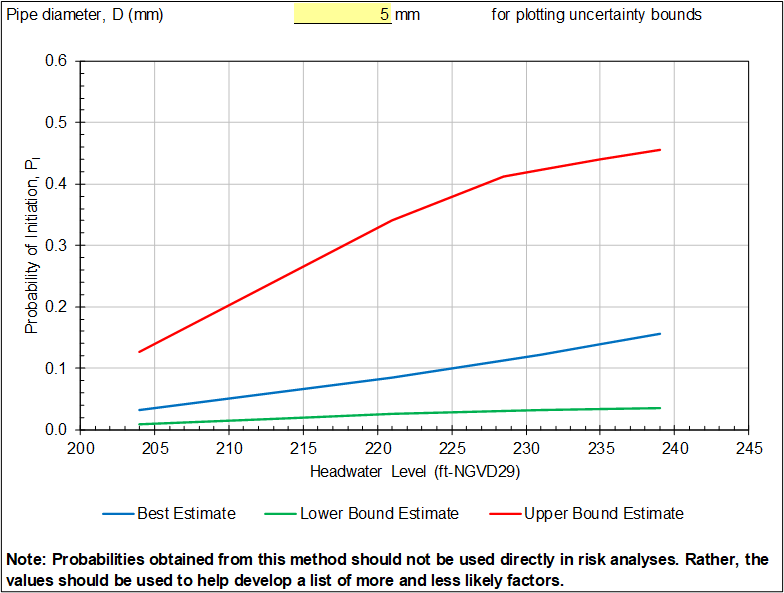
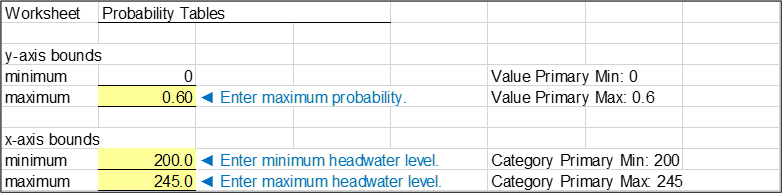
Figure illustrates the plot options for Figure. The maximum value for the y-axis (probability of initiation of concentrated leak erosion) and minimum and maximum values for the x-axis (headwater level) are user-specified.