Summary
This worksheet provides summary plots of the various methods used to assess the likelihood of BEP progression. The first plot is the average hydraulic gradient at the pipe head (black solid line) as a function of headwater level. If cycling through iterations using @RISK, the displayed results are no longer mean values; they are the selected iteration. Horizontal reference lines display for the mean field critical gradient for the adjusted Schmertmann method (blue dashed line), mean field horizontal critical gradient for the adjusted calculation rule of Sellmeijer et al. (green dashed line), inverse of Bligh’s minimum creep ratio (red dashed line), and inverse of Lane’s minimum weighted creep ratio (orange dashed line). If cycling through iterations using @RISK, the displayed results are no longer mean values; they are the selected iteration. Figure illustrates the deterministic graphical output.
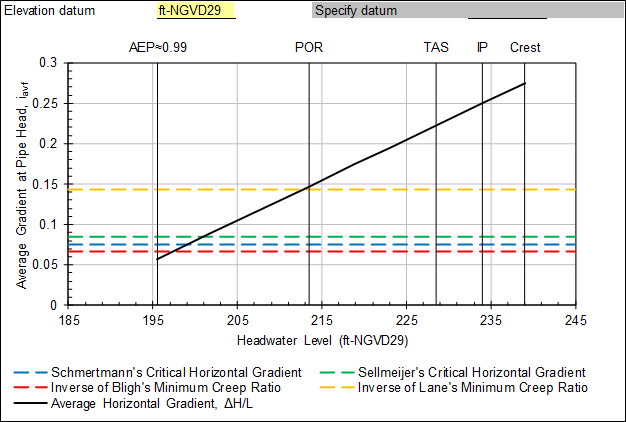
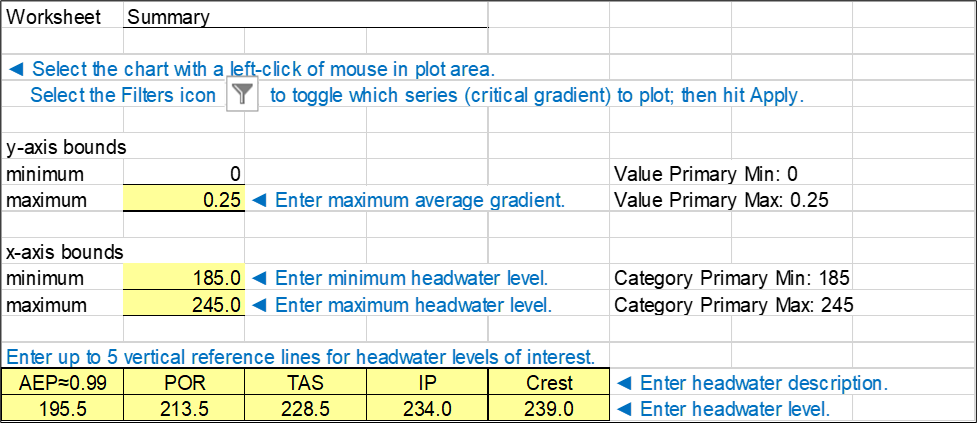
Figure illustrates the plot options for this chart. The maximum value for the y-axis (average horizontal gradient at the pipe head) and minimum and maximum values for the x-axis (headwater level) are user-specified. Users can input up to five vertical reference elevations, and user-specified labels display at the top of the chart.
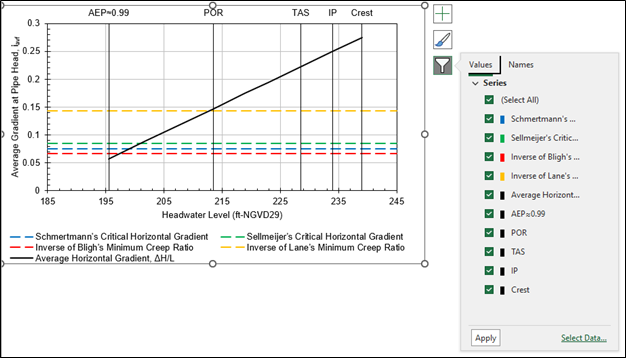
Select the chart and filter icon to display the filter pane to select or deselect data series, as shown in Figure. For example, if only the results from the adjusted Schmertmann method and inverse of Bligh’s creep ratio are judged applicable, deselecting the other data series removes them from the plot and the legend.
The second plot of the worksheet is the probability of BEP progression for the adjusted Schmertmann method (blue solid line) and adjusted calculation rule of Sellmeijer et al. (green solid line) as functions of headwater level. Because the adjusted Schmertmann method uses the probabilistic chart of Robbins and Sharp (2016) [?], expanded by Robbins and O’Leary (2020) [?], a probability of BEP progression displays for both deterministic and probabilistic analysis. However, the adjusted calculation rule of Sellmeijer et al. displays for probabilistic analysis only. Figure illustrates the probabilistic graphical output.
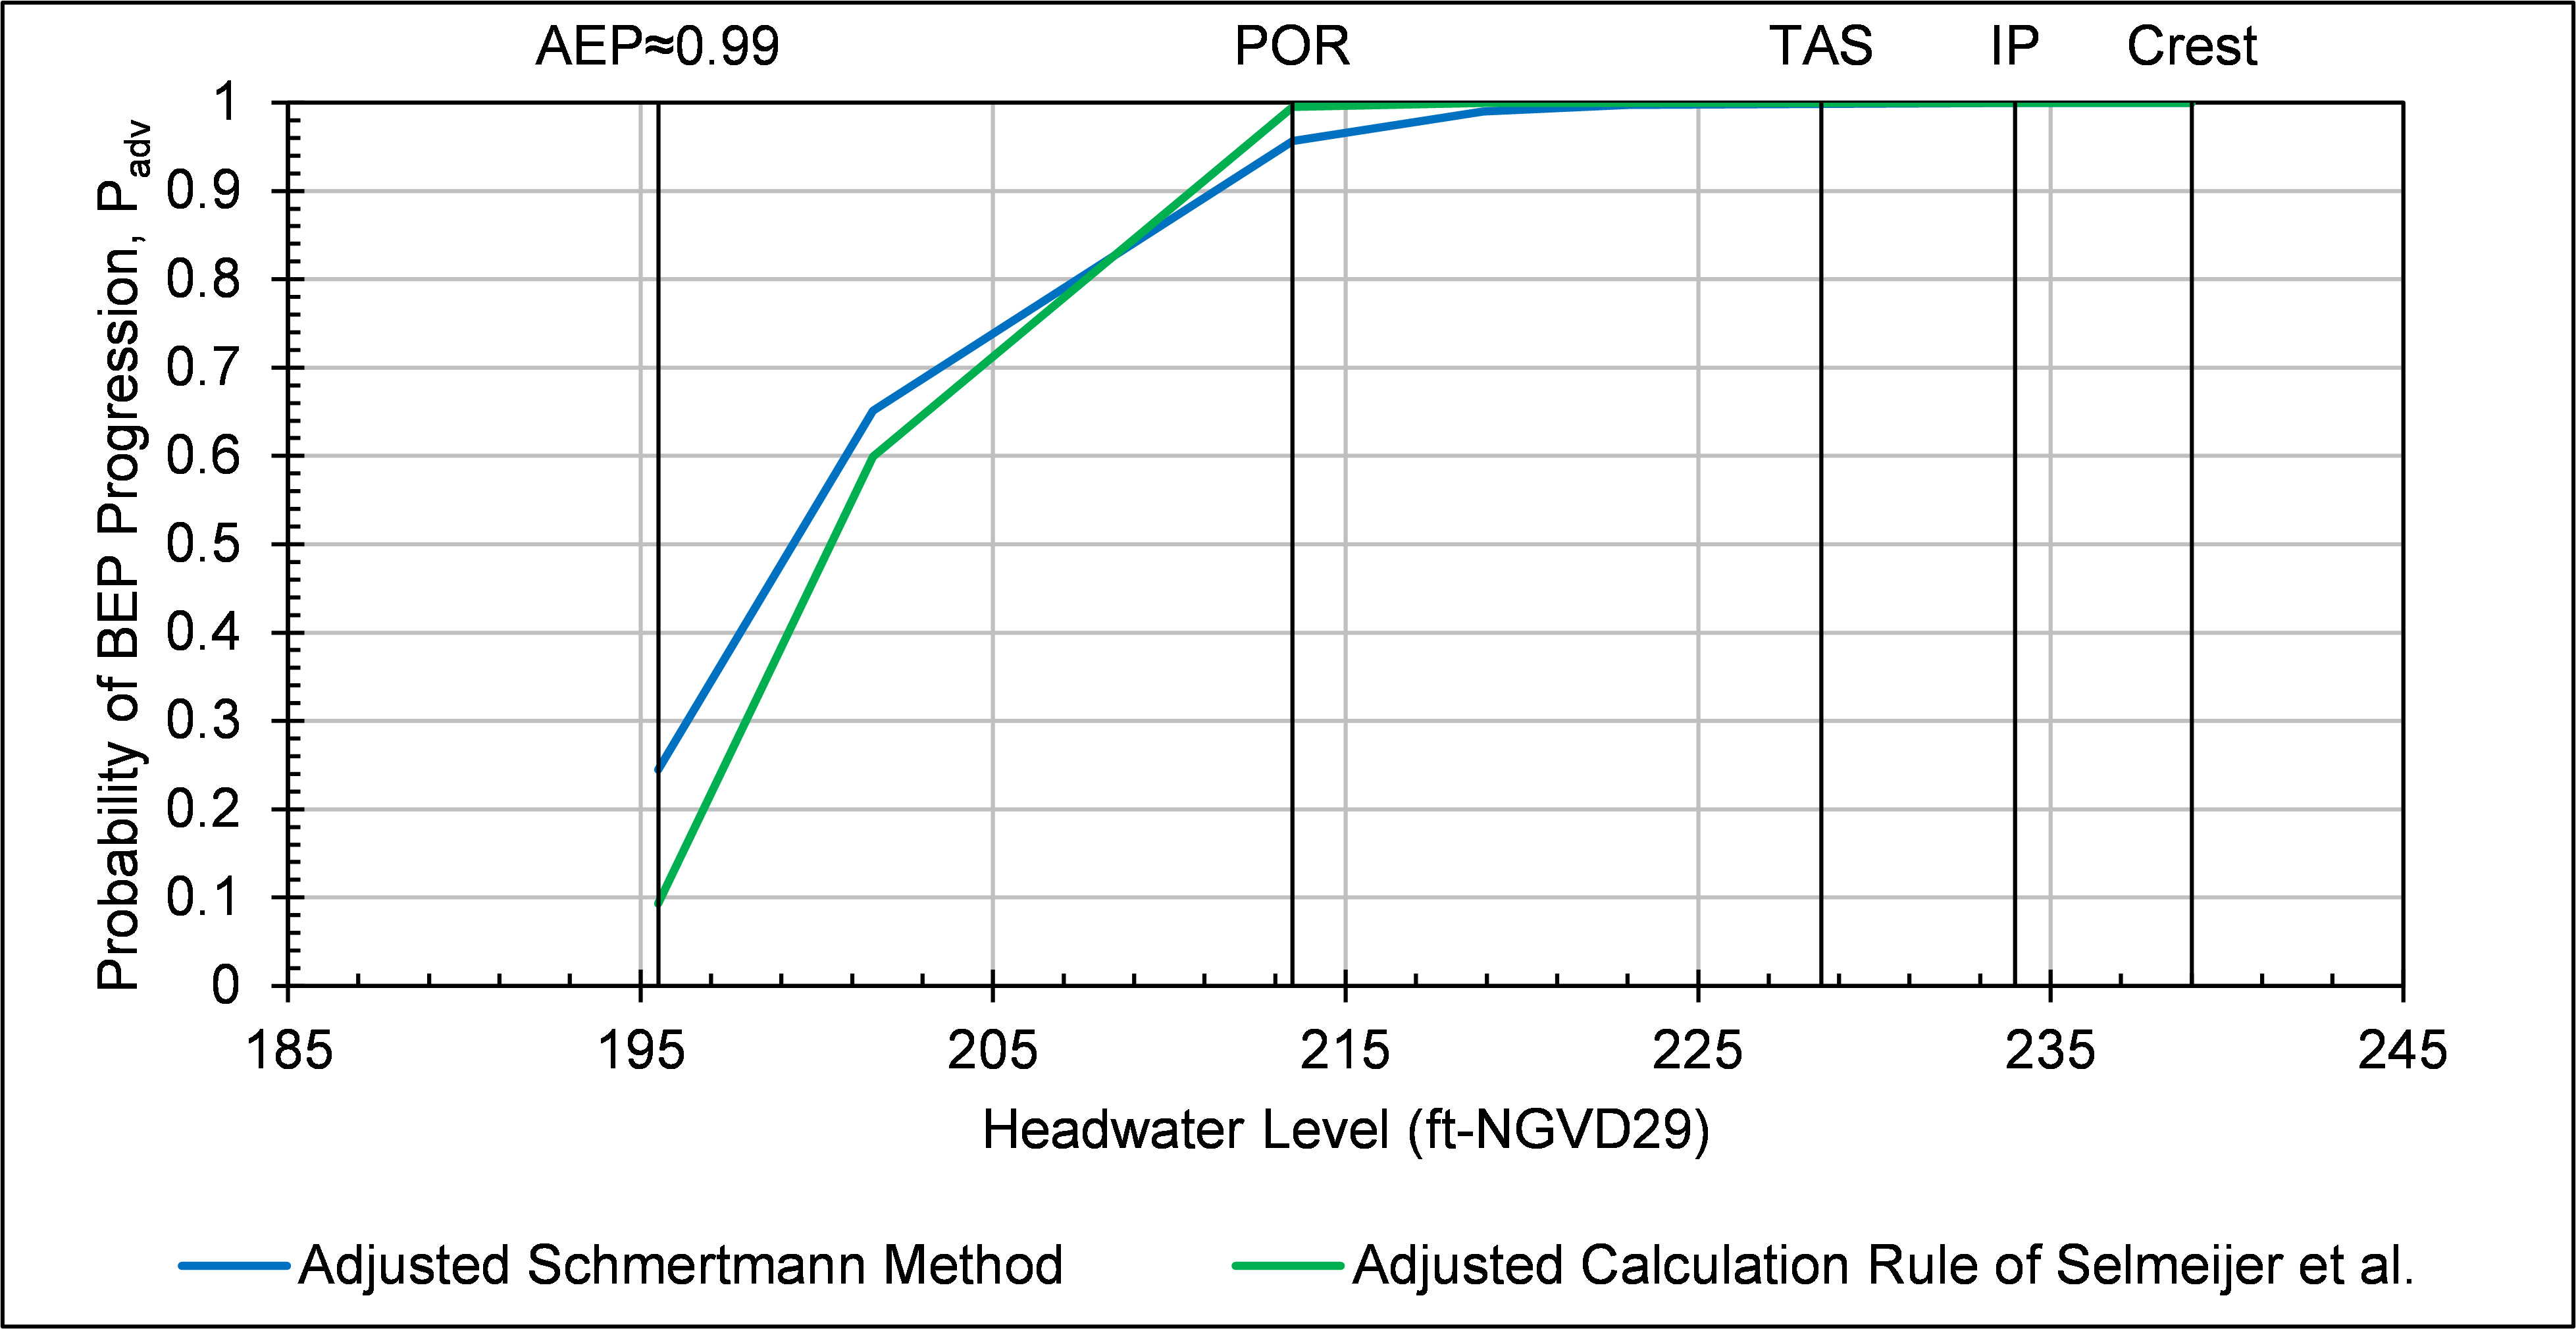
Figure illustrates the plot options for this chart. The vertical reference elevations and minimum and maximum values for the x-axis (headwater level) are the same as the input for Figure. Only the maximum value for the y-axis (probability of BEP progression) is user-specified.