
Brauns Method
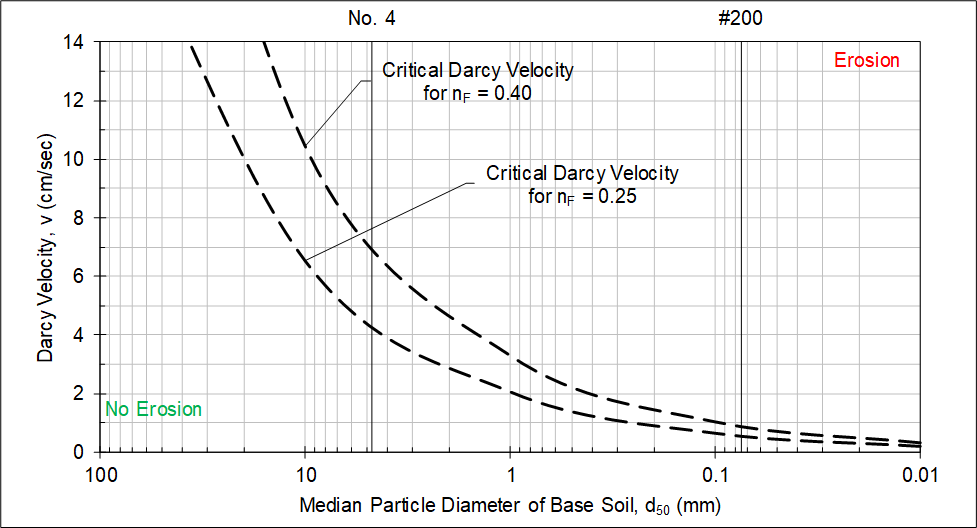
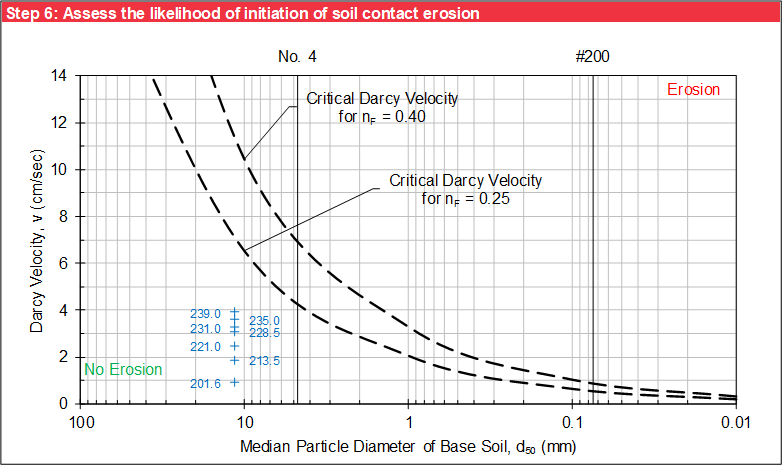
Brauns (1985) [?] proposed a relationship to estimate the critical Darcy velocity for initiation of soil contact erosion of sand below gravel as a function of median particle diameter of the sand, porosity of the gravel layer, and Darcy velocity of flow through the gravel layer. In Figure, the upper relationship is for a filter (gravel layer) porosity of 0.40, and the lower relationship is for a filter (gravel layer) porosity of 0.25.
Methods of Analysis
The method of analysis is the same as for the Guidoux et al. worksheet.
Base Soil Characterization
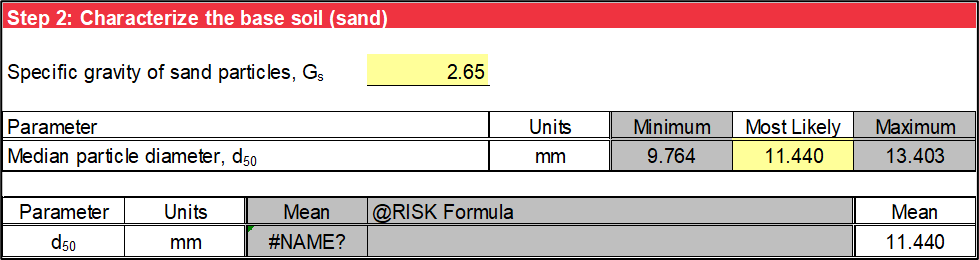
Step 2 characterizes the base soil. This input includes specific gravity of soil particles (Gs) and median particle diameter of the base soil (d50). The median particle diameter of the base soil (d50) is informed by the calculated values on the Gradation worksheet.
The selections in step 1 affect the input for step 2, and cells that do not apply have a gray background. These cells are not used in subsequent calculations even if data is present.
For deterministic analysis, input only the most likely value of d50. The mean value used for subsequent calculations is the most likely (or mode) value. Figure illustrates the deterministic input.
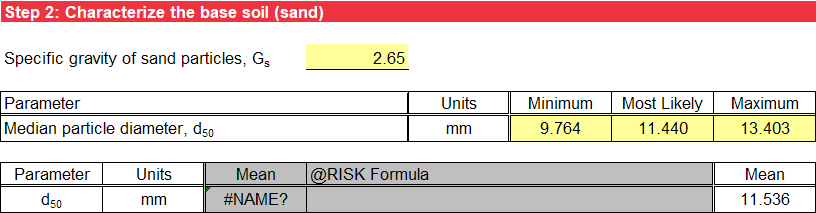
For probabilistic analysis without using @RISK, input the minimum and maximum values in addition to the most likely value, and a triangular distribution represents d50. The mean value used in subsequent calculations is the average of the minimum, most likely, and maximum values. Figure illustrates the probabilistic input without using @RISK.
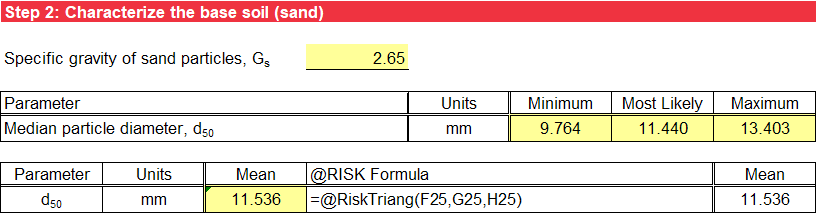
For probabilistic analysis using @RISK, input the minimum, most likely, and maximum values of d50, and use an @RISK formula for a triangular distribution in the third column as a default. Alternatively, input a valid @RISK distribution in lieu of this default formula, and the user-specified input displays in the fourth column. The mean value used for subsequent calculations is the mean for the @RISK distribution entered in the third column. Figure illustrates the probabilistic input using @RISK.
If using @RISK to perform probabilistic analysis, delete unnecessary calculation worksheets because the simulation is performed for all worksheets in the workbook, and this is time consuming. If cycling through iterations using @RISK, the displayed results are no longer mean values of the random variables; they are the selected iteration’s values.
Filter (Gravel Layer) Characterization
The filter (gravel layer) characterization is the same as for the Guidoux et al. worksheet.
Critical Darcy Velocity for Initiation of Soil Contact Erosion
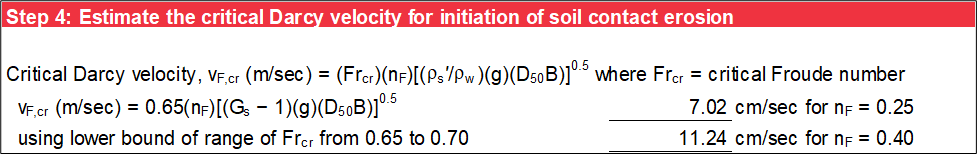
Step 4 calculates the critical Darcy velocity (vF,cr) for initiation of soil contact erosion for sand below gravel as shown in Equation.
where:
Frcr = critical Froude number (0.65)
nF = porosity of the filter (gravel layer)
ρs = density of the base soil particles (sand)
ρw = density of water
g = acceleration of gravity
d50 = median particle size of the base soil (sand)
Since it is easier to estimate the specific gravity of soil particles than the submerged density of soil particles, the following substitution is made to the equation for vF,cr. as shown in Equation.
where:
Gs = specific gravity of the base soil particles (sand)
Therefore, Equation shows that the equation for vF,cr can be simplified to:
Brauns (1985) [?] showed that the critical Froude number is between 0.65 and 0.70 and recommended using the lower value of 0.65, which results in a lower critical Darcy velocity. Critical Darcy velocities are calculated for filter (gravel layer) porosities of 0.25 and 0.40, providing an upper and lower estimate as shown in Figure.
Darcy Velocity of Flow in the Filter (Gravel Layer)
The Darcy velocity of flow in the filter (gravel layer) is the same as for the Guidoux et al. worksheet.
Likelihood of Initiation of Soil Contact Erosion
Step 6 compares the calculated Darcy velocity of flow in the filter (gravel layer) to the critical Darcy velocity for initiation of soil contact erosion. The equation for FS against initiation of soil contact erosion is the same as for the Guidoux et al. worksheet.
For deterministic analysis, the mean Darcy velocity of flow in the filter (gravel layer) is plotted as a function of headwater level and mean median particle diameter of the base soil (d50). Reference lines for the critical Darcy velocity of flow through the filter (gravel layer) for porosities of 0.25 and 0.40 display as dashed lines. When a Darcy velocity at a given headwater level plots above the line of critical Darcy velocity based on the porosity of the filter (gravel layer), the FS is greater than 1, and initiation of soil contact erosion is not predicted. Figure illustrates the graphical output of Darcy velocity for deterministic analysis.
For probabilistic analysis, a black box is also plotted showing the distribution limits for median particle diameter of the base soil and Darcy velocity of flow in the filter (gravel layer). Reference lines for the critical Darcy velocity of flow through the filter (gravel layer) for porosities of 0.25 and 0.40 display as dashed lines. Initiation of soil contact erosion is predicted for median particle diameters and headwater combinations within the black box plotting above the line corresponding to the critical Darcy velocity being evaluated. Figure illustrates the graphical output of Darcy velocity for probabilistic analysis. The two labels for critical Darcy velocity can be moved within the plot area as necessary for clarity.
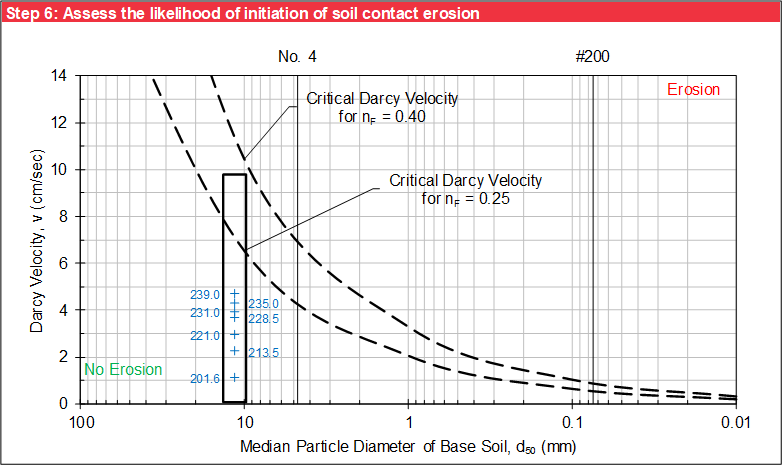
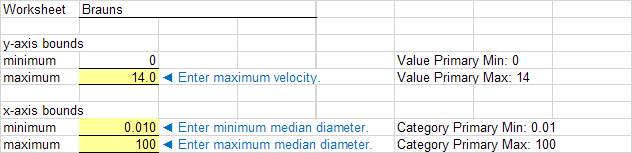
Figure illustrates the plot options for this chart. The maximum value for the y-axis (velocity) and minimum and maximum values for the x-axis (median particle diameter of the base soil) are user-specified.
The remainder of this step is the same as for the Guidoux et al. worksheet.
Headwater Level for Initiation of Soil Contact Erosion
The headwater level for initiation of soil contact erosion is the same as for the Guidoux et al. worksheet.