Gross Enlargement
For concentrated leak erosion, the resistance to initiation is characterized by the critical shear stress (τ). When the applied hydraulic shear stress exceeds the critical value (τc), concentrated leak erosion will initiate. The rate of pipe enlargement in the progression phase is characterized by the erodibility coefficient (kd). The rate of erosion () is the rate of volume of material removed per unit surface area per unit time and is calculated using the excess shear stress equation shown in Equation.
where:
kd = erodibility coefficient
τ = hydraulic shear stress
τc = critical shear stress
The hydraulic shear stress (τ) on the surface of a circular pipe can be estimated using Equation (see the Cylindrical Pipe section of the RMC Concentrated Leak Erosion (Initiation) Toolbox Technical Manual for more details).
where:
γw= unit weight of water
i = hydraulic gradient across the embankment core
D = diameter of the pipe
Figure shows the approximate time for a concentrated leak pipe in an embankment to enlarge from 1 inch (25 millimeters) to 3 feet (1 meter) in diameter as a function of erosion resistance and hydraulic gradient based on Hole Erosion Test (HET) results and the following assumptions.
-
Cross-section of the pipe is uniform from upstream to downstream (waterside to landside).
-
Headwater remains constant.
-
Steady uniform flow occurs through the pipe.
-
Head loss is linear from upstream to downstream (waterside to landside).
-
Frictional resistance is uniform along the surface of the pipe.
-
Frictional resistance is equal to the driving force.
Erosion resistance increases from left to right in Figure. Even in the most resistant of soils, enlargement occurs in only 100 to 500 hours (4 days to 3 weeks). The approximate time to erode to 6 feet (2 meters) is about 20 percent greater.
This worksheet estimates the diameter of a cylindrical concentrated leak pipe through an earthen embankment as a function of time during erosion using Equations 1 and 2 and the method described in Wan and Fell (2002) [?]. In addition to the previously listed assumptions, the enlarging pipe is assumed to sustain a roof up until collapse at failure. Equation calculates the rate of erosion per unit surface area at a given time.
where:
ψt = surface area of the pipe at time t
= rate of soil volume removal during erosion at time t
kd = erodibility coefficient
τc = critical hydraulic shear stress
The surface area of the pipe at any given time is equal to the wetted perimeter (Pw) multiplied by the length of the pipe (L), as shown in Equation.
where:
Dt = pipe diameter at time t
Combining Equation and Equation and dividing by L obtains the erosion loss per unit length, as shown in Equation and Equation.
Assuming the pipe enlarges the same amount radially in all directions and is not limited by a non-erodible boundary, Equation to Equation derive the change in pipe diameter at a given time (dφt) from the change in pipe volume per unit length .
Because the change in pipe diameter cannot be negative, the negative root from the solution to the quadratic equation is neglected. The resulting solution is Equation to calculate the diameter of a cylindrical pipe as a function of time during erosion.
Pipe Diameter Characterization
Input the embankment crest elevation (C), initial pipe elevation (B), and length of pipe (L) at the beginning of step 1. Dam break analysis typically assumes the pipe diameter at failure (Df) occurs when the pipe diameter reaches twice the vertical distance from the crest to the roof of the pipe (Hp) (Visser et al. 2013 [?]). Based on this assumption, the pipe diameter at failure is equal to the difference between the crest elevation (C) and the initial elevation of the pipe (B), as shown in Figure.
The initial estimate of pipe diameter at failure provides an anchoring value to help inform judgment for the user-specified input. Input the minimum, most likely (mode), and maximum values for the initial pipe diameter and the pipe diameter at failure at the end of step 1. Although these values represent a triangular distribution, a probabilistic analysis is not performed. Instead, the values are used to perform a sensitivity analysis. Figure illustrates the pipe diameter characterization.
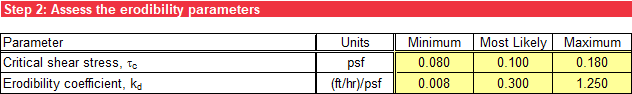
Erodibility Parameters
In step 2, the erodibility parameters are defined. Input includes the minimum, most likely (mode), and maximum estimates for the critical shear stress and the erodibility coefficient of the embankment material, as shown Figure. Although these values represent a triangular distribution, a probabilistic analysis is not performed. Instead, the values are used to perform a sensitivity analysis. The RMC Erodibility Parameters Toolbox contains empirical relationships and published values based on field and laboratory testing.
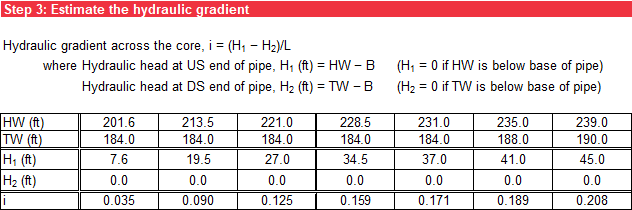
Hydraulic Gradient
Step 3 calculates the average hydraulic gradient through the pipe by dividing the net hydraulic head across the pipe by the length of the pipe for each defined headwater-tailwater combination, as shown in Figure. If the headwater elevation is below the pipe elevation, the upstream hydraulic head (H1) is zero; if the tailwater is below the pipe elevation, the downstream hydraulic head (H2) is zero.
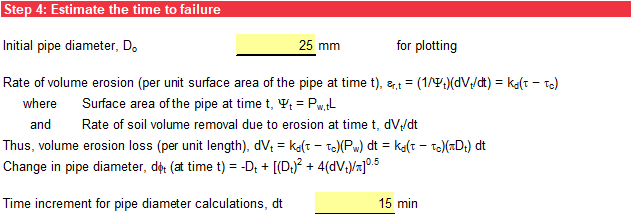
Estimated Time to Failure
In step 4, select the initial pipe diameter used in the subsequent plots from the drop-down list. The minimum, most likely (mode), and maximum values of initial pipe diameter from step 1 can be evaluated.
Select the time increment for the pipe diameter calculations from the drop-down list. Time increments of 5, 10, 15, 30, and 60 minutes can be evaluated. Because gross enlargement is typically rapid, use care when selecting this time increment. The results of the analysis can be very sensitive to the time increment. Choose the smallest time increment possible to provide adequate resolution on how the pipe diameter changes with time, but it also must be large enough to allow enough time in the analysis for the pipe diameter to enlarge to failure. If the average hydraulic shear stress on the sidewalls does not exceed the critical shear stress for a given headwater level, concentrated leak erosion initiation is not predicted, and the pipe diameter remains constant with time. When the critical shear stress is exceeded, concentrated leak erosion initiation is predicted, and the pipe diameter increases with time. The rate of pipe enlargement also accelerates with time.
Figure illustrates the input for time to failure calculations.
Summary plots portraying the change in pipe diameter as a function of time are provided for each of the erodibility estimates in step 2. Figure provides an example plot for the most likely erodibility parameters. The results for the most likely erodibility estimate use the most likely values for both the critical shear stress and the erodibility coefficient. The results for the low erodibility estimate use the maximum critical shear stress and the minimum erodibility coefficient. The results for the high erodibility estimate use the minimum critical shear stress and the maximum erodibility coefficient. Horizontal reference lines for the minimum, most likely, and maximum estimates of the pipe diameter at failure display on all three plots. A table summarizing the number of hours for the pipe to exceed each of the estimated pipe diameters at failure from step 1 is provided under each plot.
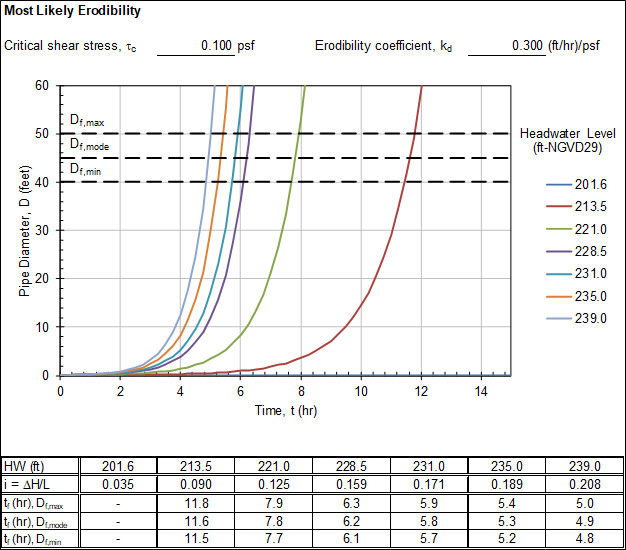
Figure illustrates the plot options for this chart. The maximum value for the x-axis (time) is user-specified.