Unraveling
This worksheet evaluates the stable rock size for flow through a rockfill as a function of the unit discharge for a given downstream slope.
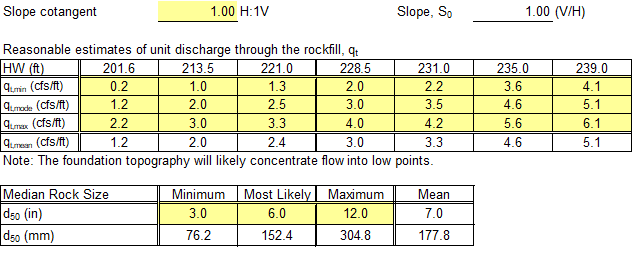
At the beginning of the worksheet, input the slope cotangent, estimates of the unit discharge for each headwater level being considered, and the median rock size. Input the minimum, most likely (mode), and maximum values for both the unit discharge through the rockfill and the median rock size. The mean estimate of the median rock size is calculated as the average of the minimum, most likely (mode), and maximum values. Although these values represent a triangular distribution, a probabilistic analysis is not performed. Instead, the values are used to perform a sensitivity analysis. The slope, unit discharge, and median rock size characterization input are illustrated in Figure.
Solvik (1991) and Olivier (1967)
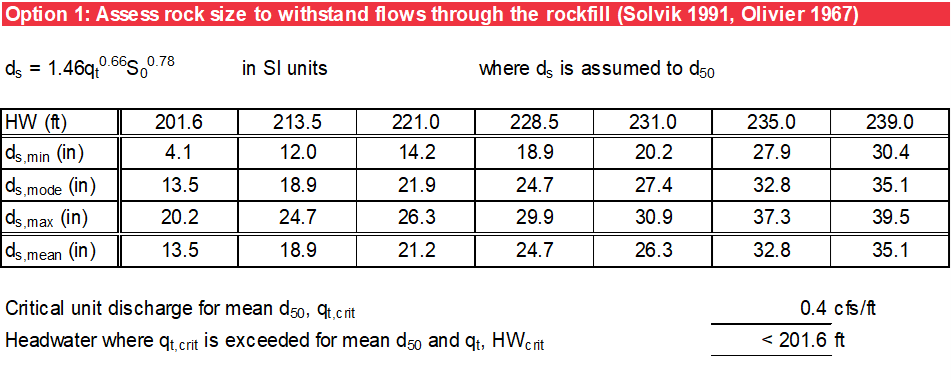
Option 1 evaluates the minimum stable rock size needed to withstand a given unit discharge through rockfill using Equation developed by Solvik (1991) [?] based on sloping flume test results. It is the same method presented in Olivier (1967) [?] but converted to metric units.
where:
ds = minimum stable rock size (m) for the rockfill, assumed to be the median rock size ()
qt = unit discharge through the rockfill (m3/s/m)
So = downstream slope (measured as V/H)
The minimum stable rock size is calculated as a function of unit discharge and the downstream slope for the minimum, most likely (mode), maximum, and mean unit discharges. The critical unit discharge is also calculated for the mean d50 , and the headwater elevation where that critical unit discharge is first exceeded is linearly interpolated from the user-specified headwater-mean unit discharge relationship. Figure illustrates the calculations for this option.
EBL (2005) Method
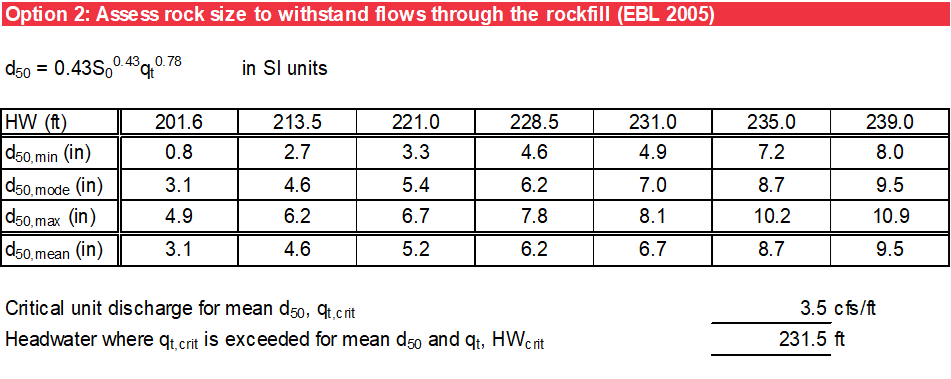
Option 2 evaluates the minimum stable rock size needed to withstand a given unit discharge through rockfill using Equation from EBL (2005) [?] based on model tests of flow through rockfill dams up to 20 feet tall. The calculations are the same as in Option 1, except for the equation to calculate rock size. Figure illustrates the calculations for this option.
where:
d50 = median rock size (m) needed for stability
Summary
The mean unit discharge through the rockfill is plotted as a function of headwater level and mean value of d50 at the bottom of the worksheet, as shown in Figure. Reference lines for the critical d50 (median rock size needed for stability) for Solvik (1991) [?] and Olivier (1967) [?] (black dashed line) and EBL (2005) [?] (black solid line) are also plotted as a function of unit discharge through the rockfill. When a unit discharge through the rockfill at a given headwater level plots right of a line of critical d50 , the rockfill is predicted to be unstable. A blue box is also plotted showing the parameter limits for unit discharge through the rockfill and median rock size.
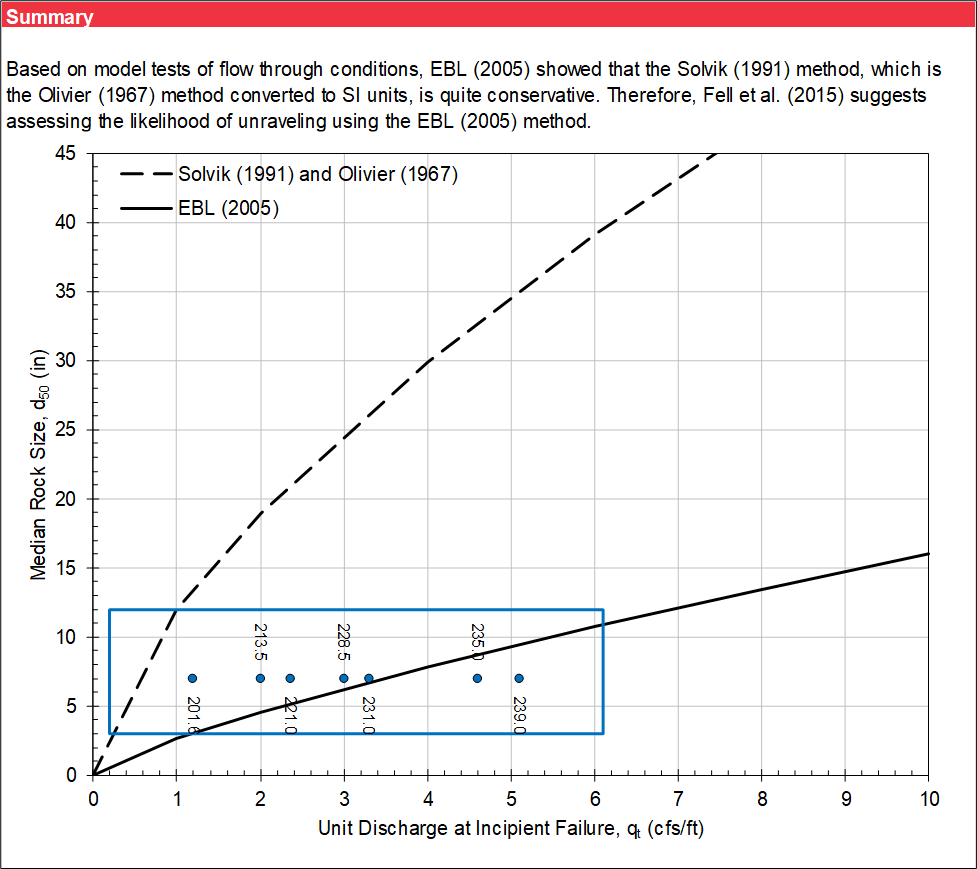
Figure illustrates the plot options for this chart. The maximum values for the y-axis (median rock size) and x-axis (unit discharge) are user-specified.