Site-Specific Data
The Site-Specific Data worksheet is for probabilistic seismic hazard analysis (PSHA) and deterministic seismic hazard analysis (DSHA) data developed for the site for comparison against the USGS hazard curves.
Probabilistic Seismic Hazard Analysis
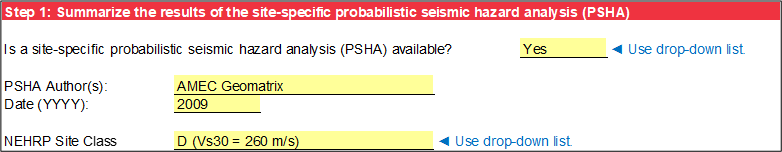
In step 1, the PSHA input must be enabled or disabled. If a site-specific PSHA is not available, select “No” from the drop-down list so that any residual input data for the site-specific PSHA is not used (Figure). Conditional formatting then applies a gray background.

If a site-specific PSHA is available, select “Yes” from the drop-down list to enable the PSHA input (Figure). Additional input includes adding the author and completion date for the site-specific PSHA and selecting the NEHRP Site Class from the drop-down list. A site-specific PSHA may have been completed for a vs30 other than those listed in the drop-down list; however, for comparison to the USGS hazard curves, the nearest vs30 should be selected. The input generates the series names that appear in the legend for the hazard curves.
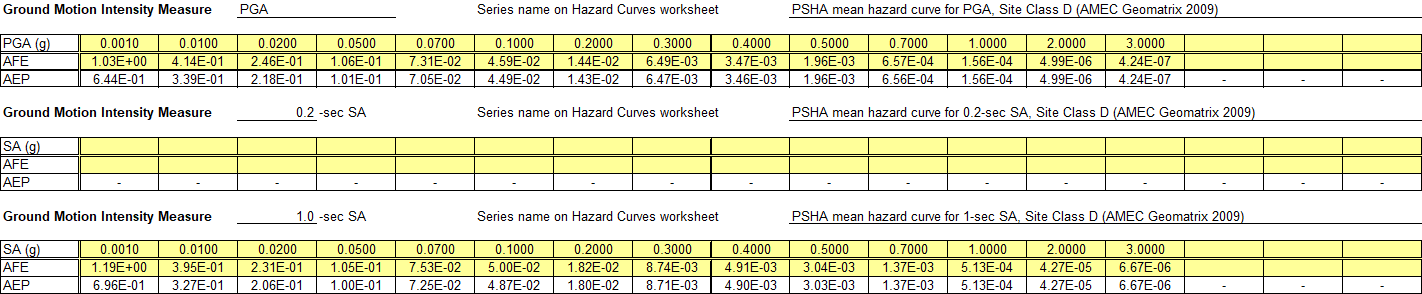
Up to five site-specific hazard curves may be inputted. AFE is the assumed input, which is converted to AEP as previously described. If a data file is available for the site-specific PSHA, both the ground motions and AFE must be copied from the data file and pasted as values (Figure). PGA, 0.2-second SA, and 1-second SA are fixed selections to facilitate comparison to USGS seismic hazard curves. Up to two additional SAs can be evaluated. Each curve can contain a maximum of 20 data points.
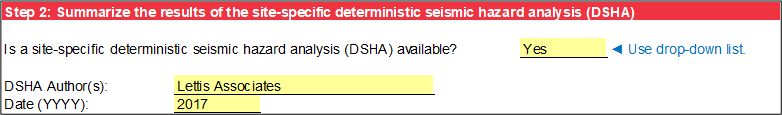
Deterministic Seismic Hazard Analysis
In step 2, the DSHA input must be enabled or disabled. If a site-specific DSHA is not available, select “No” from the drop-down list so that any residual input data for the site-specific DSHA is not used (Figure). Conditional formatting then applies a gray background.

If a site-specific DSHA is available, select “Yes” from the drop-down list to enable the DSHA input. Additional input includes adding the author and completion date for the site-specific DSHA (Figure).
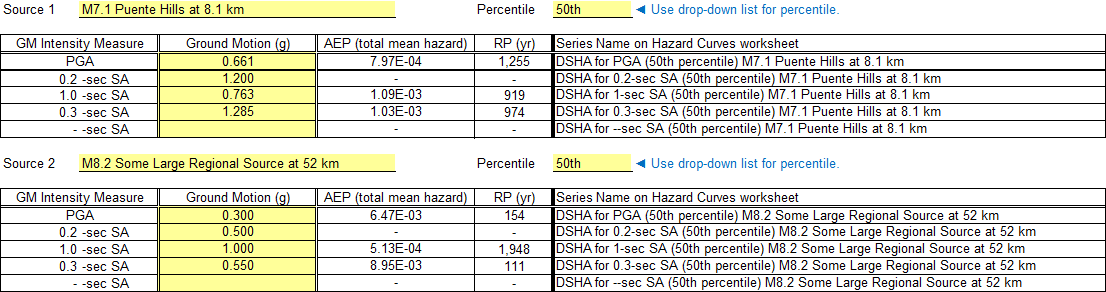
While any number of DSHA response spectra can be developed for a site, it is common practice to develop two response spectra: a nearby source that is representative of the short-period hazard and a more distant source that is representative of the long-period hazard. Therefore, up to two DSHA spectra may be inputted. Since the intent is for DSHA spectra to be plotted as information along with the PSHA hazard curves, ground motions for the same five spectral periods used for the site-specific PSHA may be inputted. The developer of the DSHA must decide what epsilon value (i.e., number of standard deviations about the median) to use for the ground motion prediction equation (GMPE). The most common values are 0 (the median, which equals the 50th percentile envelope) and 1 (the median plus one standard deviation, which equals the 84th percentile envelope). Using the drop-down list to select the percentile generates the series names that appear as vertical reference lines on the hazard curves plot.
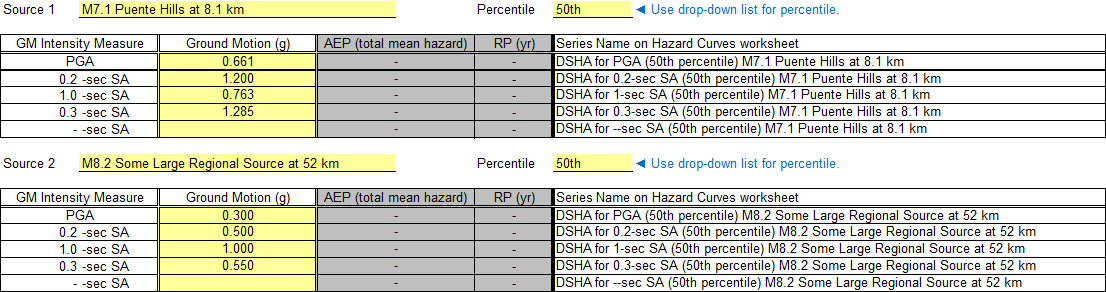
After inputting the response spectrum values, the AEP of each ground motion level is interpolated from site-specific PSHA hazard curves, if available, in step 1. The AEP values are interpolated using the z-variate scale for AEP and the logarithmic scale for ground motion and rounded to three significant digits. The AEP is a convenient reference for the user but must be carefully interpreted. Although the DSHA ground motion is specific to a particular source, the AEP is for all sources included in the PSHA. If a site-specific PSHA is not available, conditional formatting adds a gray background to cells that do not apply. Figure and Figure illustrate the two scenarios.