Modern National Seismic Hazard Model
The Modern USGS national seismic hazard model (NSHM) worksheet facilitates the importing and processing of USGS modern datasets from the USGS Earthquake Hazard Toolbox.
Site and Model Input
Use the drop-down list to select the NSHM. Information about the models is customizable at the bottom of the worksheet. Use dynamic data from the USGS Earthquake Hazard Toolbox, when available, because it is the most up-to-date model, and enter the version number.
Use the drop-down list to select the source type such as total, fault, fault cluster, fault system, grid, interface, slab, or zone. The source types are customizable at the bottom of the worksheet, and not all source types will be applicable to a given site based on the drop-down list in the USGS Earthquake Hazard Toolbox.
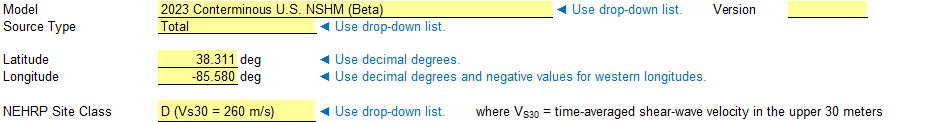
The latitude and longitude of the site of interest are user-specified input. When entering the longitude, a minus sign must precede the input if it is west of the prime meridian (e.g., locations in the United States). Conditional formatting applies an orange background if a user-specified latitude or longitude input is outside the range of applicability for the selected model at the bottom of the worksheet, and a warning message is displayed. The site and model input are illustrated in Figure.
Use the drop-down list to select the NEHRP site class [?]. The RMC Site Classification Toolbox, part of the RMC Seismic Hazard Suite, helps assess the site class. Table presents the eight site classes available to select for modern datasets in the USGS Earthquake Hazard Toolbox as a function of small-strain shear wave velocity in the upper 30 meters (100 feet) (VS30).
| Site Class | (m/s) | (ft/s) |
|---|---|---|
| A/B | 1,500 | 5,000 |
| B | 1,080 | 3,500 |
| B/C | 760 | 2,500 |
| C | 530 | 1,800 |
| C/D | 365 | 1,200 |
| D | 260 | 850 |
| D/E | 185 | 600 |
| E | 150 | 500 |
Hazard Curve Input
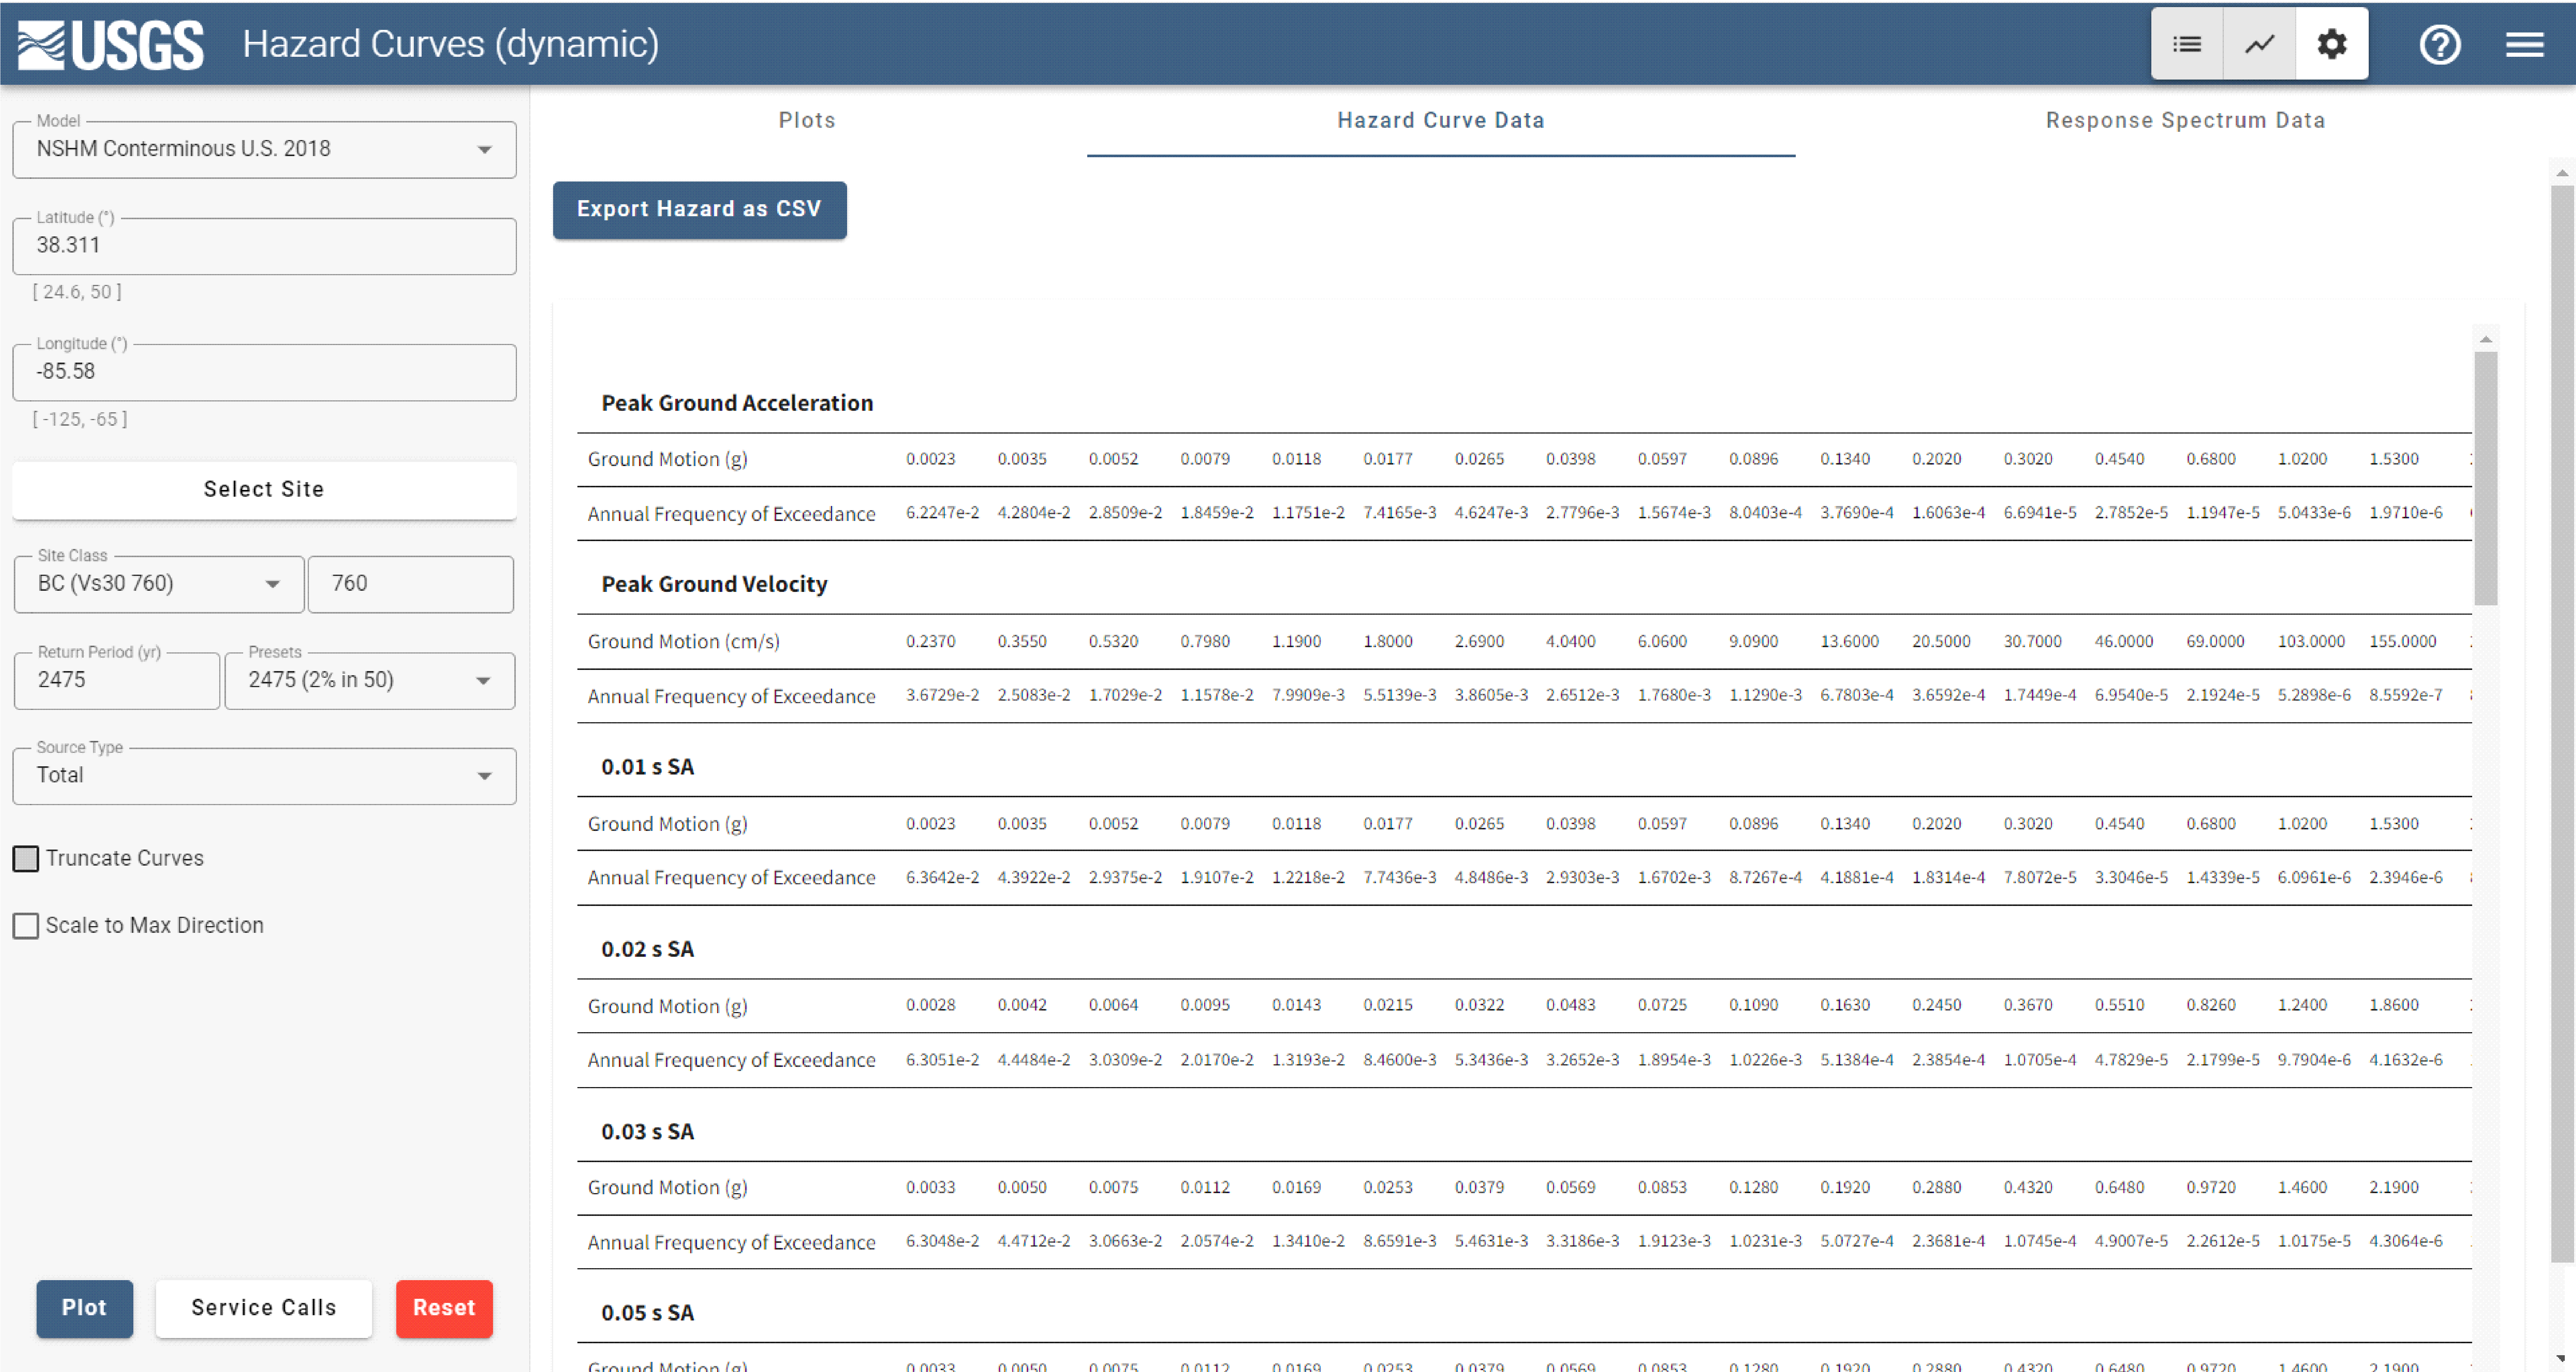
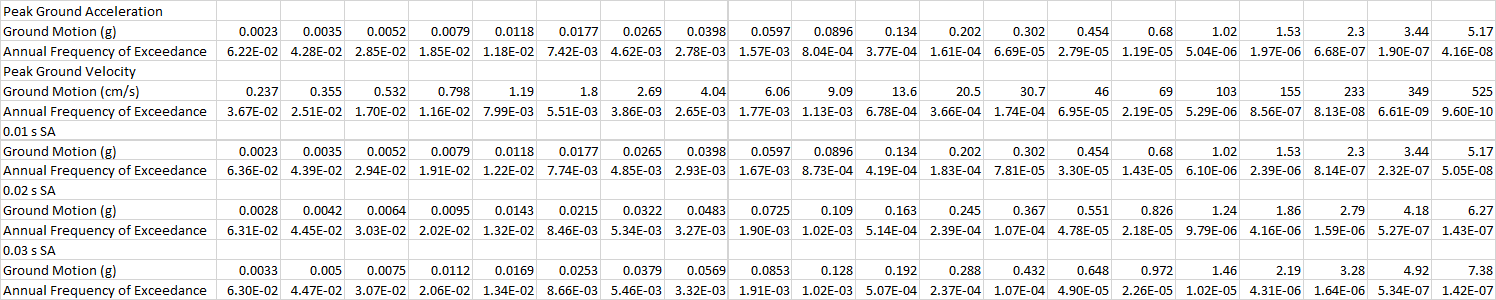
The ground motion (GM) and corresponding annual frequency of exceedance (AFE) are obtained from the USGS Earthquake Hazard Toolbox. Values for up to twenty-two ground motion intensity measures, excluding peak ground velocity (PGV), can be exported from the USGS Earthquake Hazard Toolbox as a comma-separated values (CSV) file, a text file format that uses commas to separate values. Figure is an example of hazard curve data as it appears in the USGS Earthquake Hazard Toolbox, and Figure is an example of the same data in Excel from the exported CSV file.
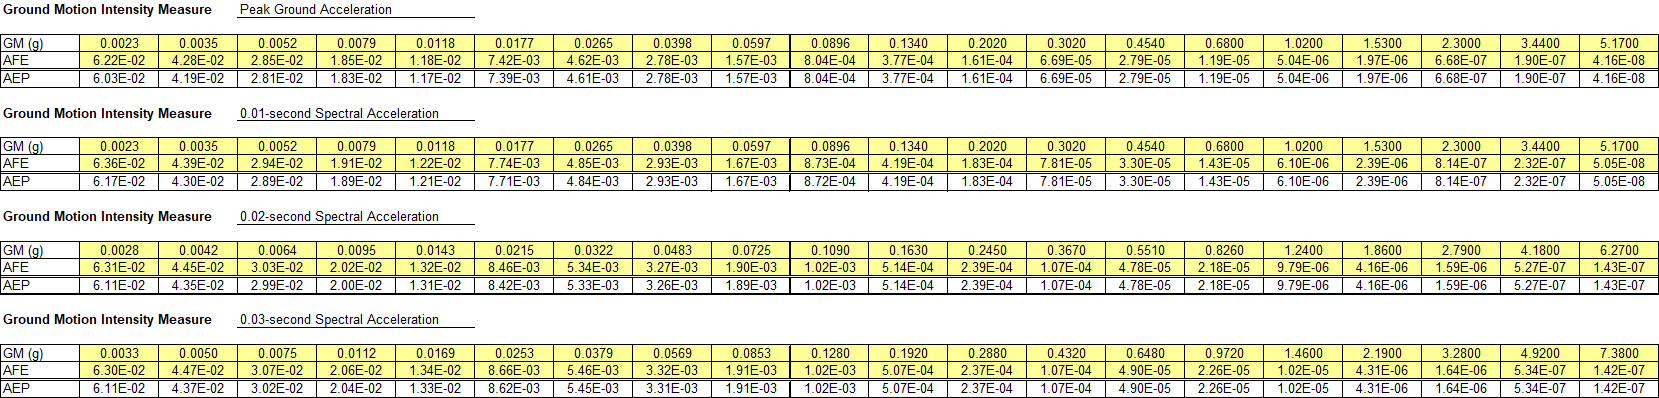
Copy GM-AFE data for each ground motion intensity measure of interest and paste as values in the appropriate cells. Clear any existing GM and AFE data from cells with a light-yellow background so that residual data does not remain after pasting values. Figure is an example of the pasted GM and AFE data and calculated AEP.
USGS provides AFE; however, risk assessments need the annual exceedance probability (AEP). The AFE is the number of times the ground motion is exceeded each year, and for very low ground motions, it may be above unity if a ground motion is exceeded multiple times each year. As the AFE becomes less than unity, the frequency of exceedance becomes analogous to a probability, becoming nearly equal to the AEP for frequencies less than approximately 1/100. Generally, structural performance and incremental risk are driven by these less frequent events, and there is little practical difference between AEP and AFE. The toolbox adjusts the AFE values so subsequent calculations use probabilities. The relationship between AEP and AFE is provided as Equation.
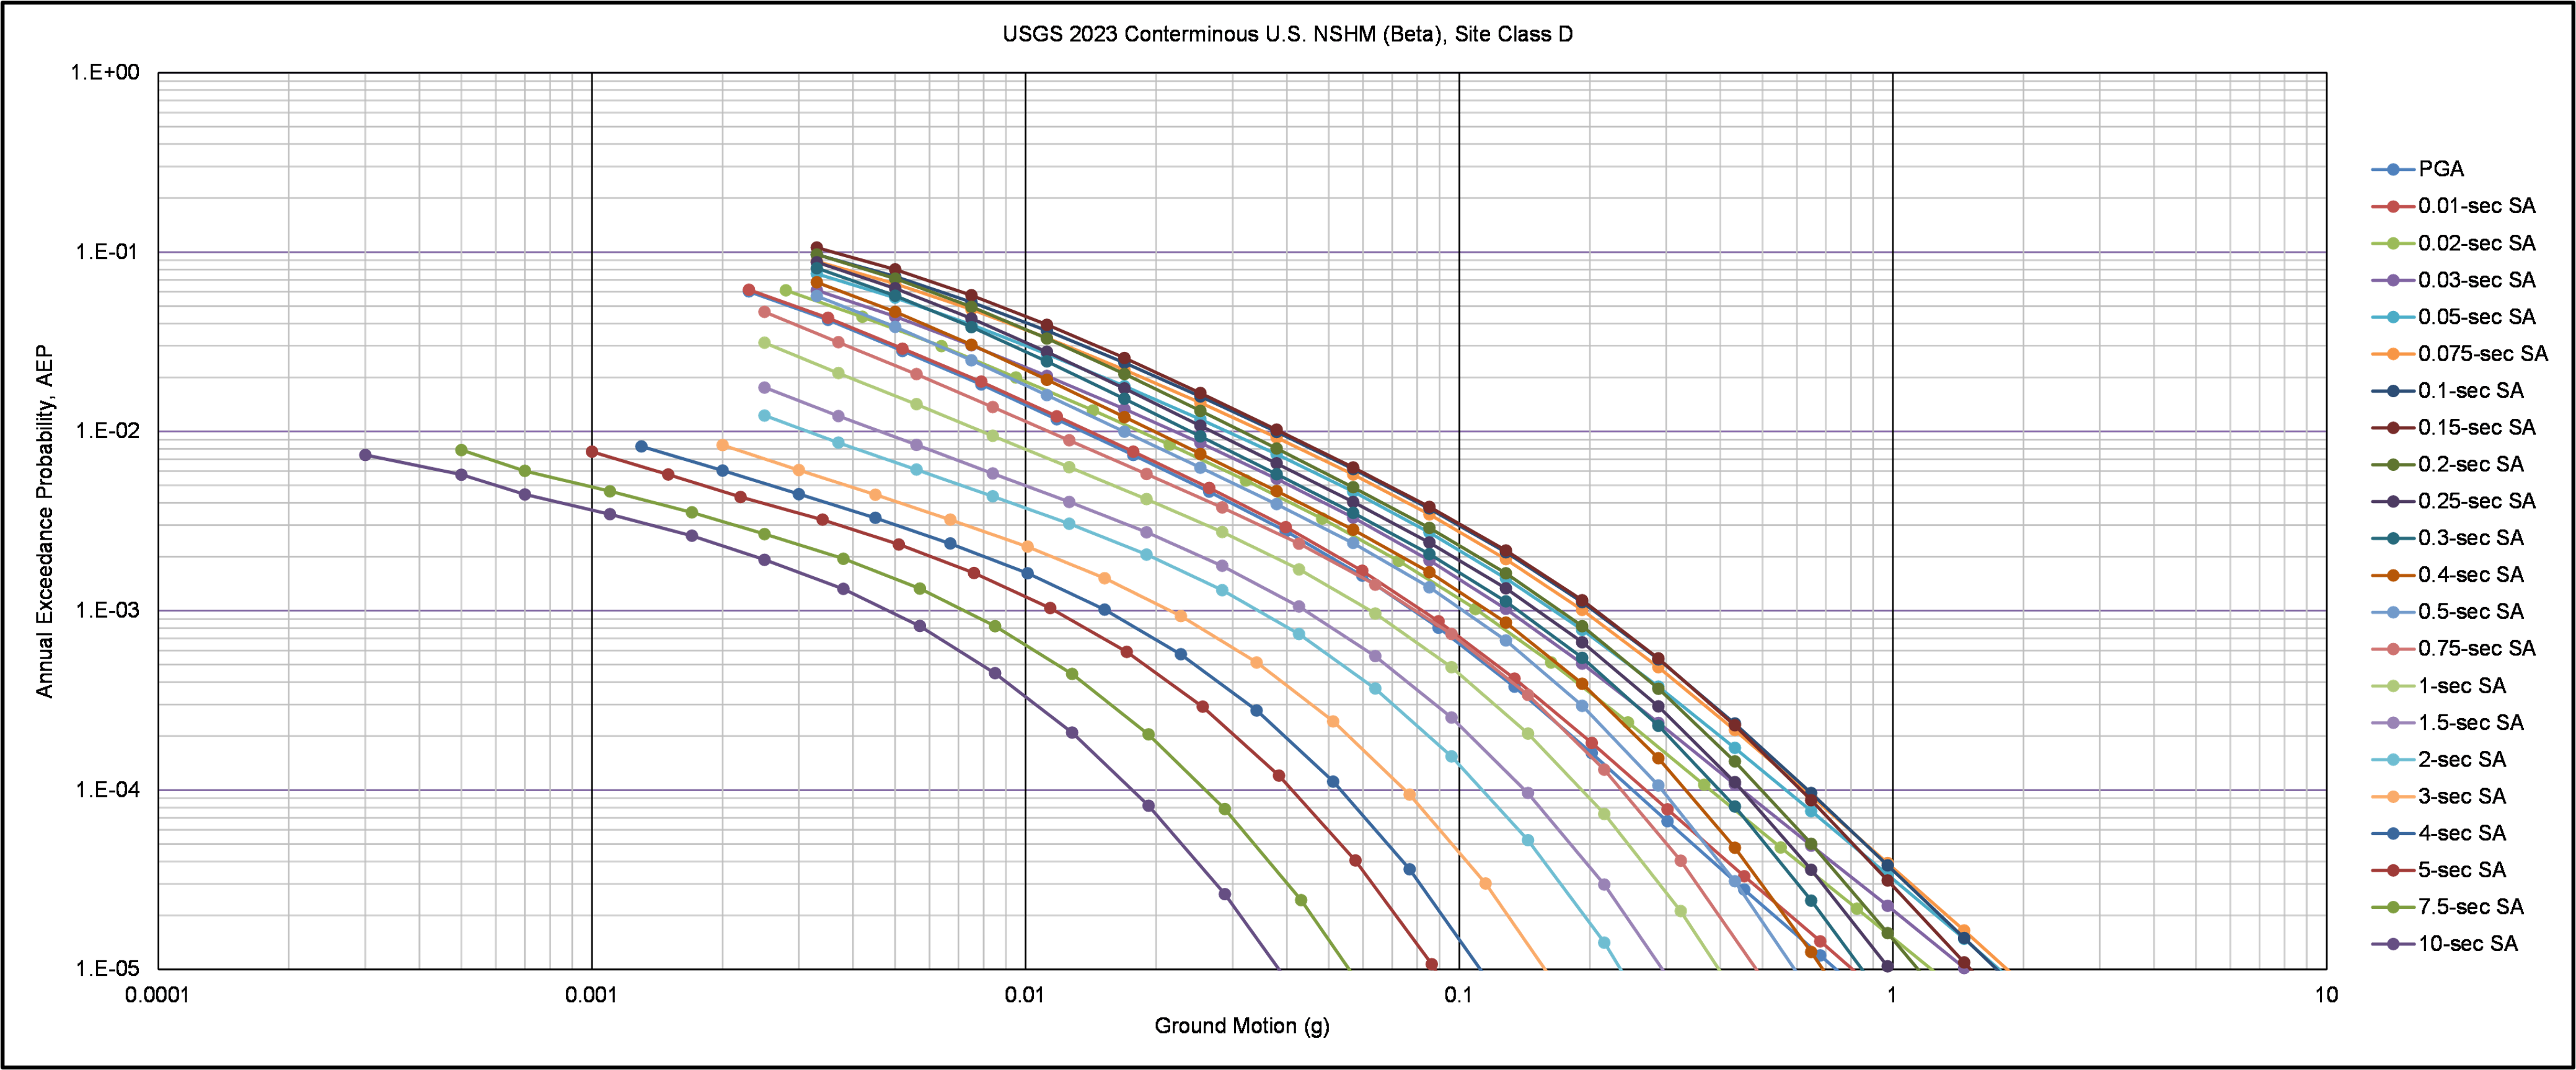
Plots of GM as a function of AEP for the user-specified site class are at the bottom of the worksheet as illustrated in Figure.