Hazard Curves
The Hazard Curves worksheet provides summary tables of ground motions for user-specified return periods and plots selected hazard curves.
Summary Tables
Use the drop-down list to characterize the USGS long-term dataset as either Modern or Legacy.
Use the drop-down to indicate whether to include the short-term (one-year) forecast for induced seismicity in the conterminous U.S. (CONUS) (as provided by Petersen et al. (2018) [?]) along with the CONUS long-term dataset. Conditional formatting applies a gray background to the cells if a CONUS long-term dataset is not selected on the Modern NSHM worksheet or a CONUS short-term dataset is not selected on the Legacy NSHM worksheet.
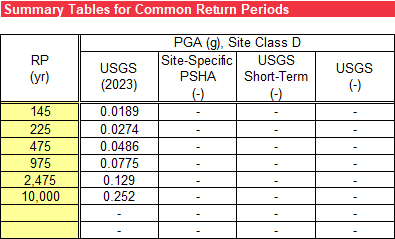
Summary tables for PGA, 0.2-second SA, and 1-second SA ground motions containing up to eight user-specified return periods (RPs), shown in Figure, can be generated. The ground motions are interpolated using the logarithmic scale for ground motion and the z-variate scale for AEP and rounded to three significant digits.
For modern long-term datasets, the NEHRP site class is obtained from the Modern NSHM worksheet. For site-specific PSHA, the NEHRP site class is obtained from the Site-Specific Data worksheet. For legacy long-term datasets, the NEHRP site class is obtained from the Site Class Effects worksheet. Figure illustrates ground motions for PGA from modern long-term datasets when induced seismicity is not included.
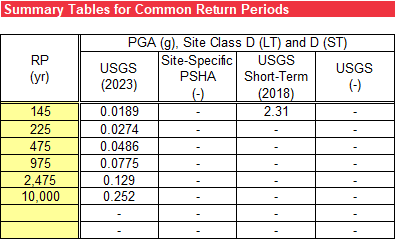
For modern CONUS long-term datasets when induced seismicity is included, the NEHRP site class is obtained from the Modern NSHM worksheet and labeled LT (long term) followed by the NEHRP site class for the CONUS short-term datasets labeled ST (short term) from the Site Class Effects worksheet because the site class could be slightly different based on the available options on those worksheets. Figure illustrates ground motions for PGA from modern long-term datasets when induced seismicity is included.
The first ground motion column in Figure and Figure summarizes the results for USGS modern long-term datasets if “Modern” is selected from the drop-down list at the top of the worksheet. The model year and ground motions are obtained from the Modern NSHM worksheet.
The second ground motion column summarizes the results for a site-specific PSHA if available. The model year and ground motions are obtained from the Site-Specific Data worksheet.
The third ground motion column summarizes the results for USGS legacy short-term (induced seismicity) datasets if a CONUS long-term dataset is selected on the Modern NSHM worksheet and a CONUS short-term dataset is selected on the Legacy NSHM worksheet. The model year is obtained from the Legacy NSHM worksheet, and the ground motions are obtained from the Site Class Effects worksheet. Ground motions display only for return periods less than the user-specified value for truncation on the Site Class Effects NSHM worksheet since the results must not be applied for very low AEP.
The fourth ground motion column summarizes the results for USGS legacy long-term datasets if “Legacy” is selected from the drop-down list at the top of the worksheet. The model year is obtained from the Legacy NSHM worksheet, and the ground motions are obtained from the Site Class Effects worksheet.
Hazard Curves
The hazard curves for the modern long-term datasets, legacy short-term datasets if induced seismicity is applicable, site-specific PSHA if applicable, and legacy long-term datasets are displayed. Figure shows that by selecting the chart and then selecting the filter icon to display the filter pane, the data series for display can be selected. This is useful when computing the results from multiple ground motion intensity measures, but not all are applicable or desired to display. Resize or move the legend box within the chart area for legibility based on the selected hazard curves. Delete data series for DSHA from legend, if applicable, because their label appears adjacent to the plotted vertical reference line.
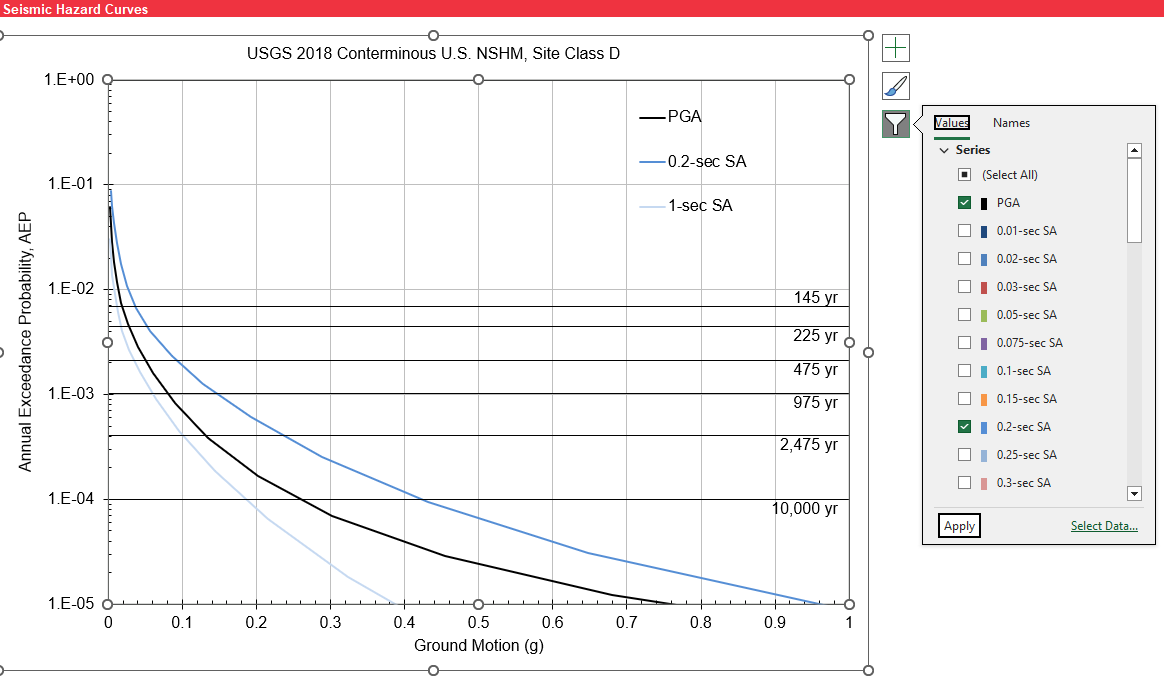
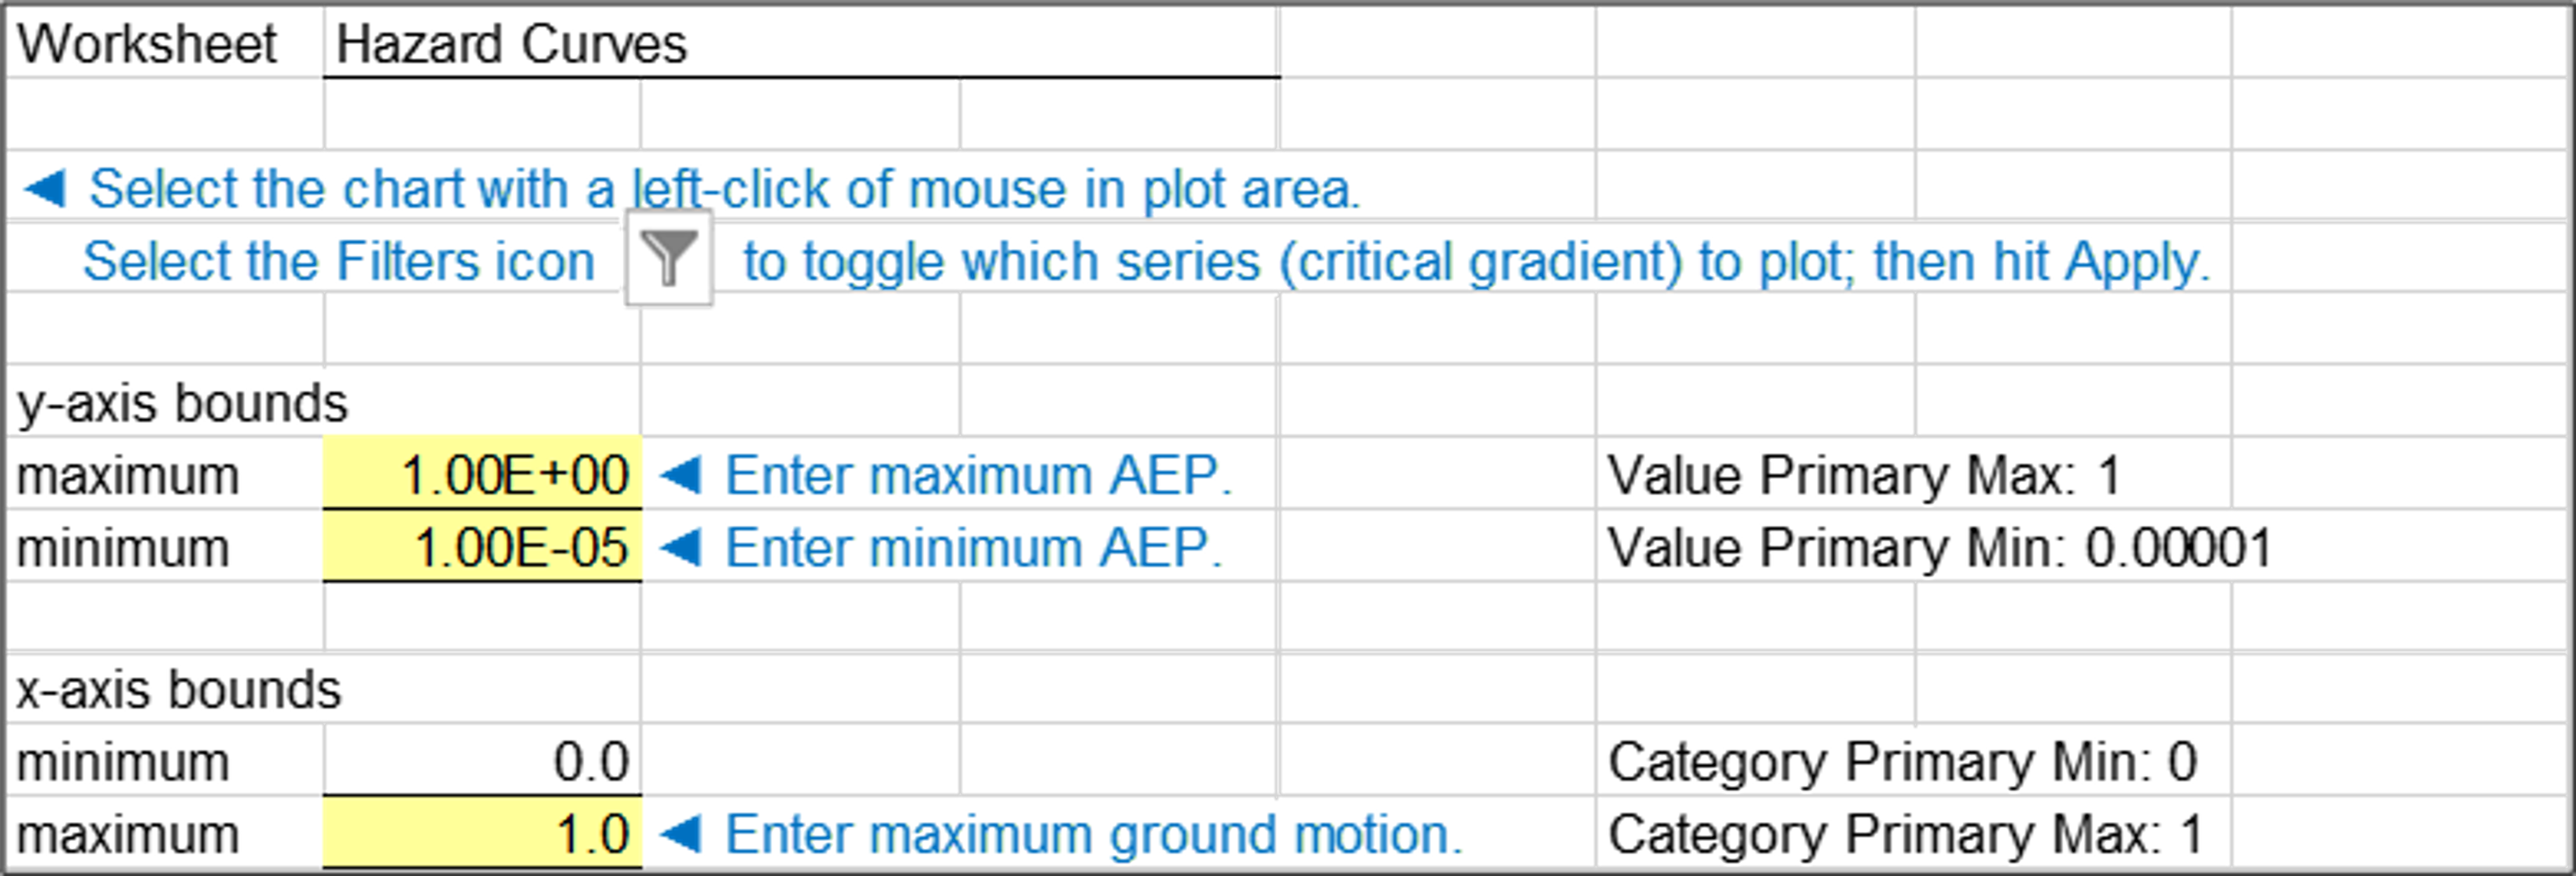
Figure illustrates the plot options for the above chart. The maximum and minimum values for the primary y-axis (AEP) and maximum value for the x-axis (ground motion) are user-specified. Up to eight horizontal reference lines can be displayed based on the user-specified return period in the summary tables.