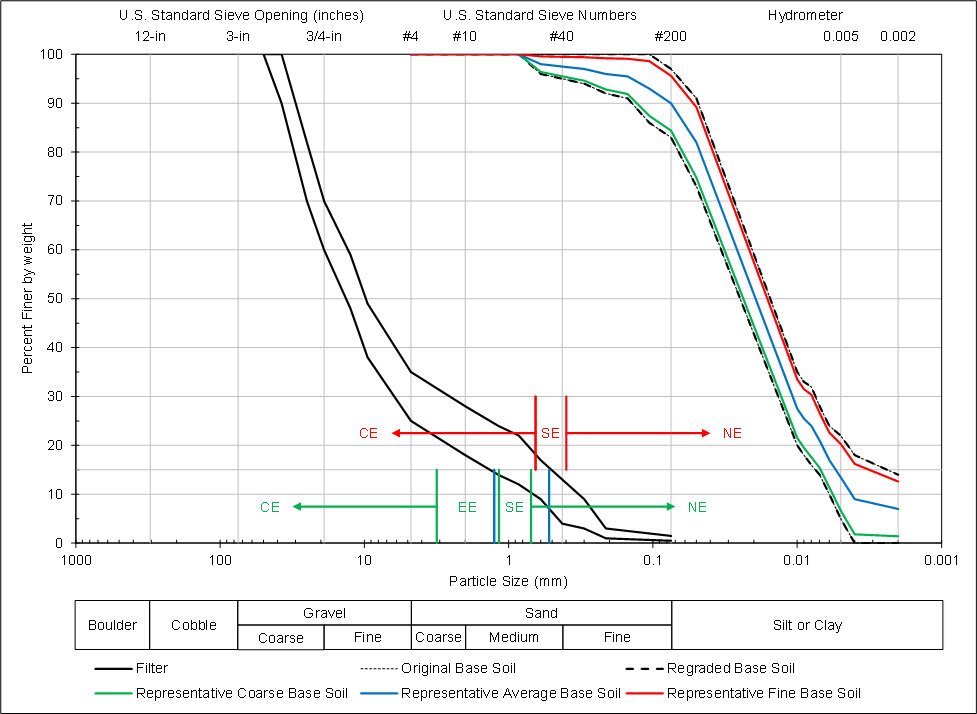
Summary Plot
This worksheet summarizes the particle retention evaluation on a cumulative particle-size plot showing the filter gradation, base soil gradation after regrading (if applicable), representative base soil gradation after regrading (if applicable), and the NE, EE, and CE boundaries for the coarse, average, and fine representative base soil gradations. There are no user-specified inputs or calculations on this worksheet.
Figure is an example of a Summary Plot worksheet. The solid black lines represent filter gradation, and the dashed black lines represent base soil gradation after regrading (if applicable). The representative coarse base soil gradation, representative average base soil gradation, and representative fine base soil gradation are displayed as green, blue, and solid red lines, respectively. If N is equal to 100 percent, the representative coarse and fine base soil gradations overlay the base soil gradation envelope after regrading (if applicable). If N is less than 100 percent, the representative coarse and fine base soil gradations plot within the base soil gradation envelope after regrading (if applicable).
The ranges of the erosion boundaries for the coarse base soil gradation and fine base soil gradation are displayed as green and red horizontal lines, respectively. The ranges for the CE and NE categories extend infinitely beyond their respective boundaries. The erosion boundaries for coarse base soil gradation and fine base soil gradation are shown as short vertical lines of the same color as the horizontal lines, and the erosion categories are labeled between the boundaries. The erosion boundaries for the average base soil gradation are shown as short blue vertical lines along the same horizontal axis as the coarse base soil gradation.