
Overview of the User Interface
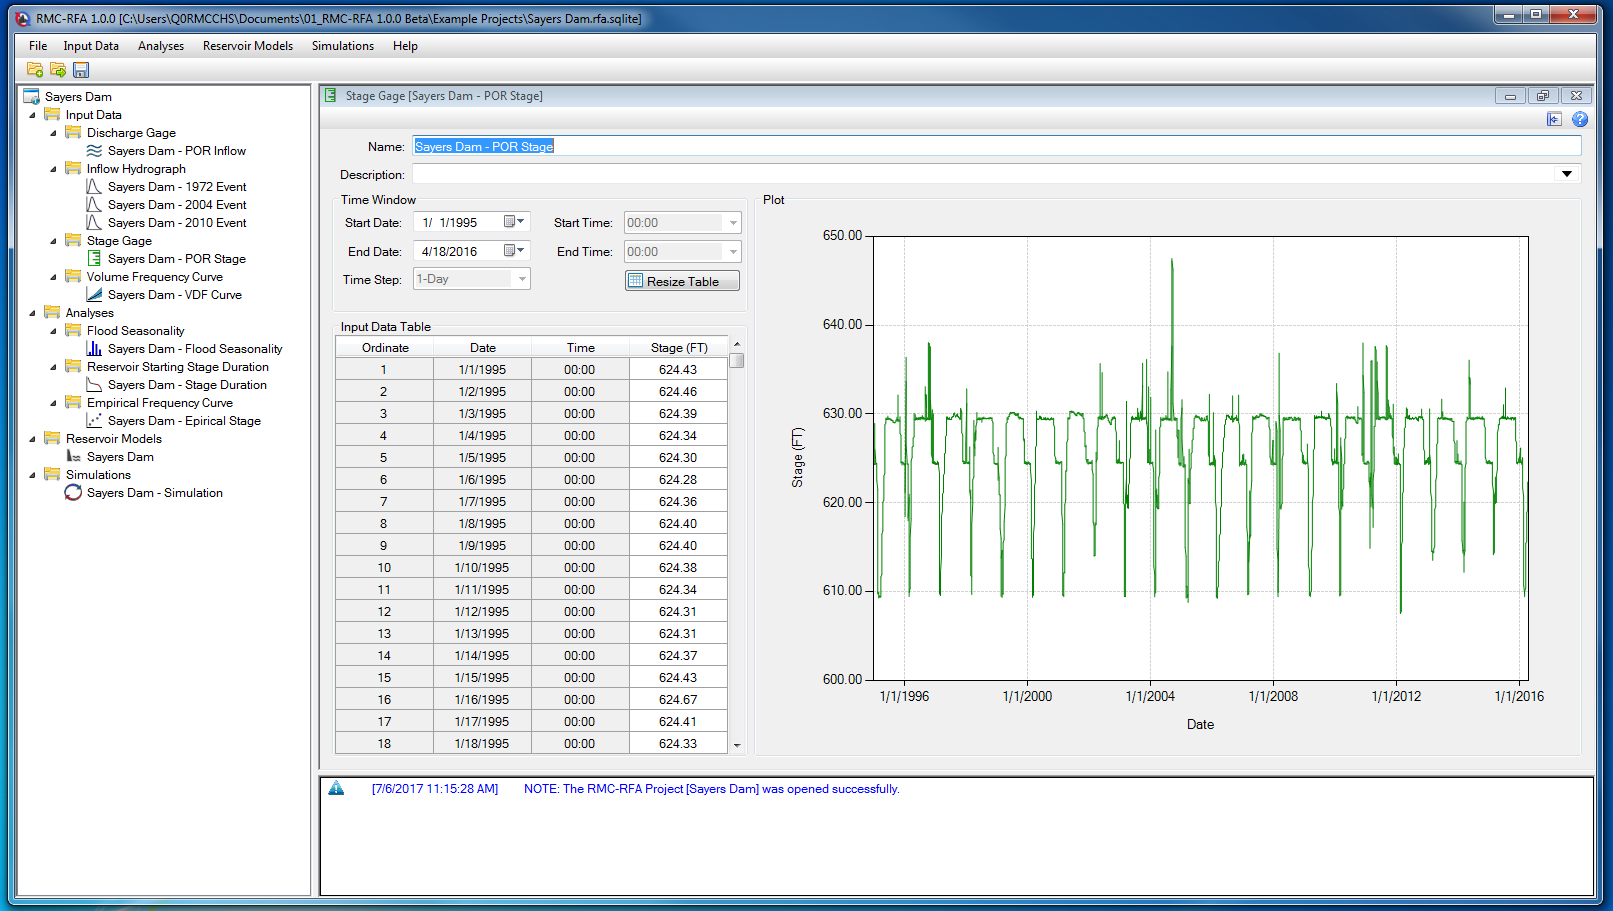
RMC-RFA is designed for interactive use in a multi-tasking environment. The software features a fully integrated modeling platform, including a graphical user interface, data entry capabilities, statistical analysis components, reservoir routing models, stochastic simulation, and results reporting tools. The RMC-RFA user interface has four primary components as shown in Figure.
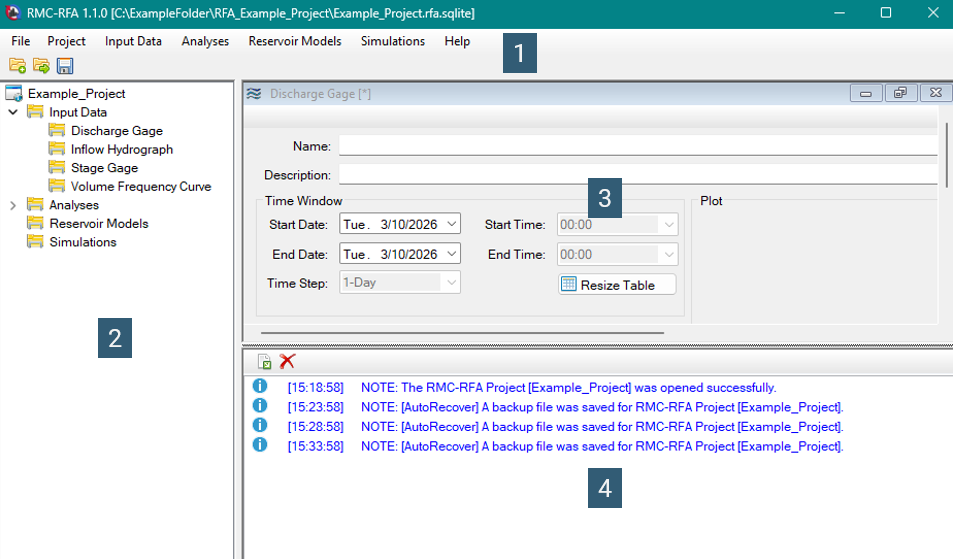
- Menu Strip
- Project Explorer
- Desktop Area
- Message Window
- Manage projects: create new, open existing, save ...
- Access to recent projects.
- Manage project components: input data, analyses, reservoir models, and simulations.
- Access to help and resources.
- Exit the application.
- Manage project: rename, edit description, change unit system.
- Manage project components: input data, analyses, reservoir models, and simulations.
- Manage project components: create new, edit, copy, rename, delete.
- Navigate project.
- Used to edit model components: input data, analyses, reservoir models, and simulations.
- Displays project notes, warnings, and errors.
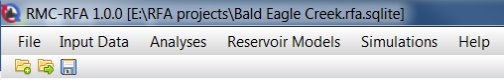
Menu Strip
At the top of the RMC-RFA main window is the Menu Strip.
- File
- Input Data
- Analyses
- Reservoir Models
- Simulations
- Help
- Tool Bar
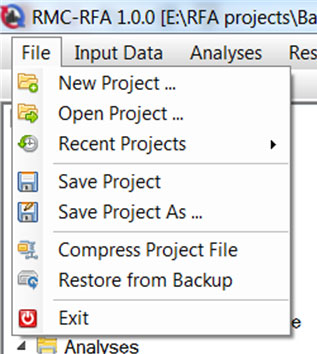
File
This menu is used for file management. Options available under the file menu include New Project, Open Project, Recent Projects, Save Project, Save Project As, Compress Project File, Restore from Backup, and Exit. The Recent Projects option lists the most recently opened projects, which allows the user to quickly open a recently used project. Compress Project File option allows the user to compress the project file into a smaller file size. Restore from Backup allows the user to restore the project from a backup file if the system is to unexpectedly quit. A file with the extension .BAK is automatically created when a project is open. If the project closes successfully, than the .BAK file is deleted. If the program freezes or your computer shuts down unexpectedly, the previous version of the project can be restored from this .BAK file.
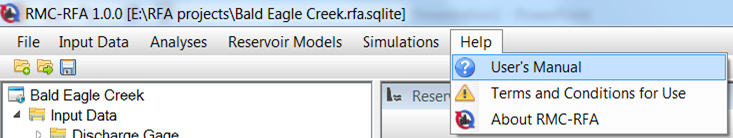
Help
The help menu allows the user access to this User's Manual, the Terms and Conditions for Use, and About RMC-RFA which provides information on the current version information of RMC-RFA.
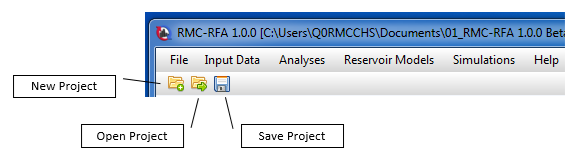
Tool Bar
At the top of the RMC-RFA main window, below the Menu Strip, is the Tool Bar. The buttons on the tool bar provide the most frequently used options under the RMC-RFA file menu.
- New Project
- Open Project
- Save Project
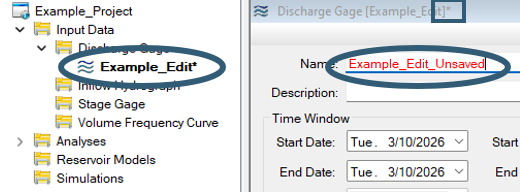
Note: When changes are made to a window, the name appears red, the name in the project explorer appears bold with an asterisk next to the name, and an asterisk appears next to the header until the project is saved. This informs the user that any changes to a data set has not yet been saved.
Project Explorer
The Project Explorer contains all the same options as those along the Menu bar without file or help, allowing for quick access to all input data, analyses, reservoir models and simulations.
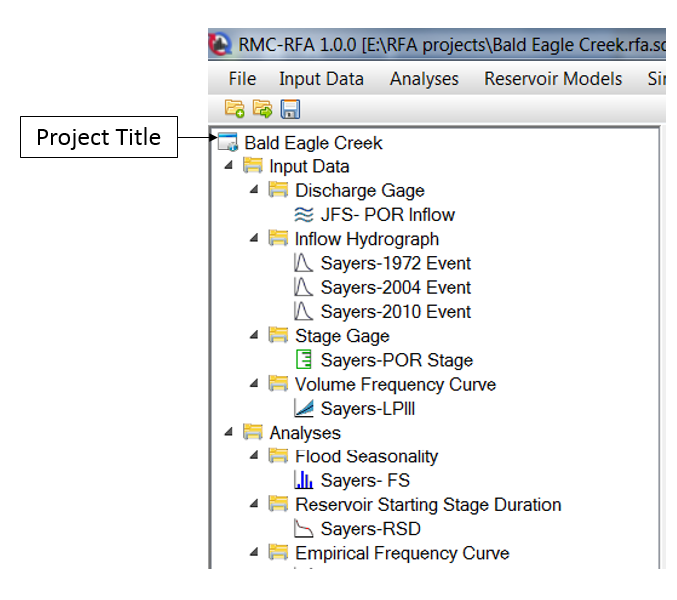
Note that the project components have a drop down arrow associate with it. When information is added to one of the branches of the project explorer, the drop down arrow appears so that the user can select this data from the project explorer. Double clicking on an item in the project explorer opens that item, or brings it to the front of the window if the item is already open.
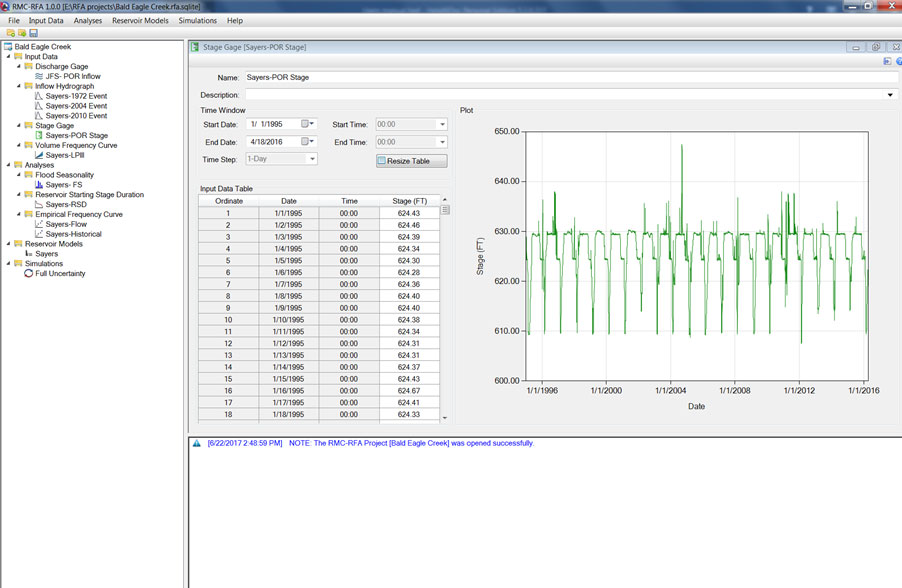
Desktop Area
The Desktop Area is used to edit model components: input data, analyses, reservoir models, and simulations.
- Docking and Undocking Forms
- Table Features
- Chart Features
Docking and Undocking Forms
RMC-RFA has a unique feature, which allows windows to be docked and undocked from the desktop. This allows the user to view more than one window at a time, and move a sub window to a different monitor to view.
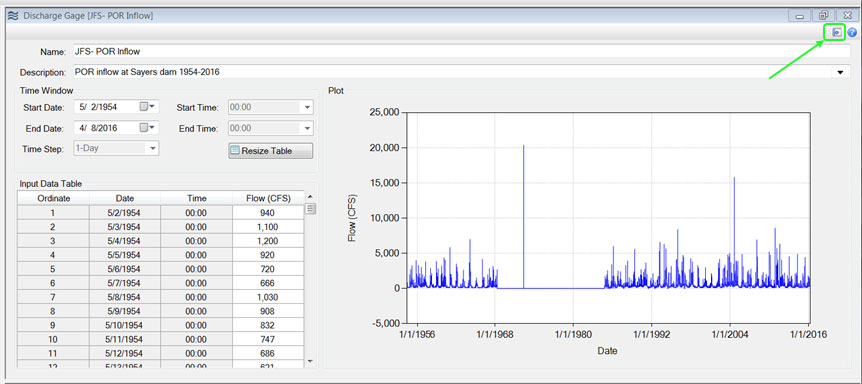
In order to undock a window from the program, click on the undock button from the window toolbar.
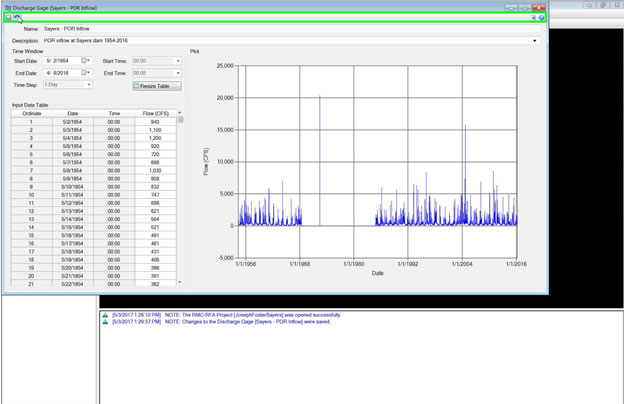
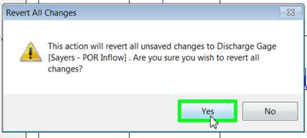
Once the window is undocked, it can be moved around the monitor or dragged to a second monitor. You can save and revert changes from this undocked window; however, this will only save or revert changes within the undocked window. It does not save or revert changes for the whole project, only for that data set. The save on the main desktop toolbar impacts the project as a whole.
In order to re-dock a window, click on the dock button.
Note: If you close the program with an undocked window open, the undocked window will close as well. You can have more than one undocked window at a time, which is useful when comparing data sets full screen.
Table Features
Each table in RMC-RFA has a context menu that will appear when right clicking on the table. Some tables are editable while other are read-only. Each read-only table has the following options:
- Select All
- Copy
- Copy with Table Headers
Editable tables will also include a Paste option. Pasting data can be performed by right clicking on the table and selecting Paste, or by typing “Ctrl+v”. The data must be in columnar format (e.g. a column from Microsoft Excel) and should contain numerical values only. By selecting the top cell in the table the user can paste the entirety of the data set copied. If a single cell other than the first cell within the table is selected, the user will paste in that cell only. The user also has the option of highlighting a number of cells and pasting into the highlighted cells.
In addition, typing "Ctrl+a" allows the user to select all, and "ctrl+shift+down" allows the user to select a continuous column of data.
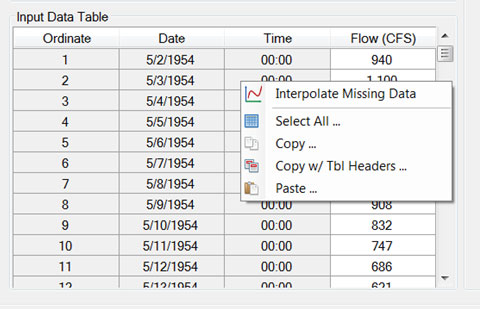
Chart Features
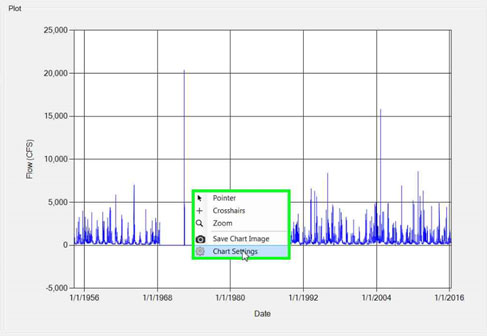
RMC-RFA has chart features which allows the user to browse and examine data, and create report-quality plots. In order to access chart features, right click on the plot on any window.
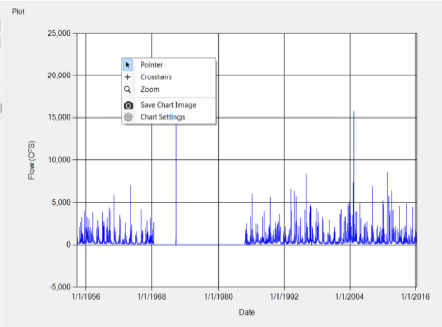
When you right click on a plot the following options appear:
- Pointer
- Crosshairs
- Zoom
- Save Chart Image
- Chart settings
Pointer
The pointer disables all other features when selected. It can be used to turn on and off displayed data by clicking the check box next to a chart series in the legend.
Crosshairs
Crosshairs allow the user to move the cursor over the chart area to get tool tip information about the plotting data points. Each plot in RMC-RFA has tool tip information specific for the plotted data series. An example of the crosshair behavior can be seen below.
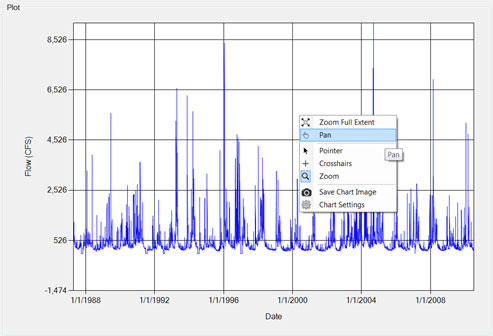
Zoom
Zoom allows the user to “zoom in” and view data more precisely at smaller intervals. Zooming works by highlighting the area of interest with the magnifying glass cursor, or by zooming in and out using the mouse wheel. When the zoom function is selected, an additional two options show up on the right click menu, zoom full extent and pan.
- Zoom full extent sets the plot back into its original extents.
- Pan allows the user to navigate through the plot by clicking and dragging in any direction.
Save Chart Image
The chart image can be saved for use in other documents or programs.
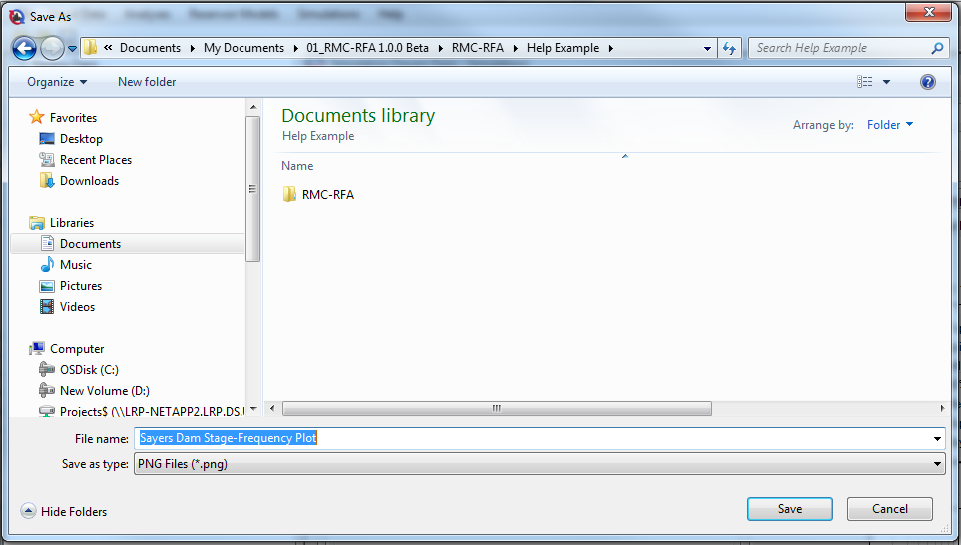
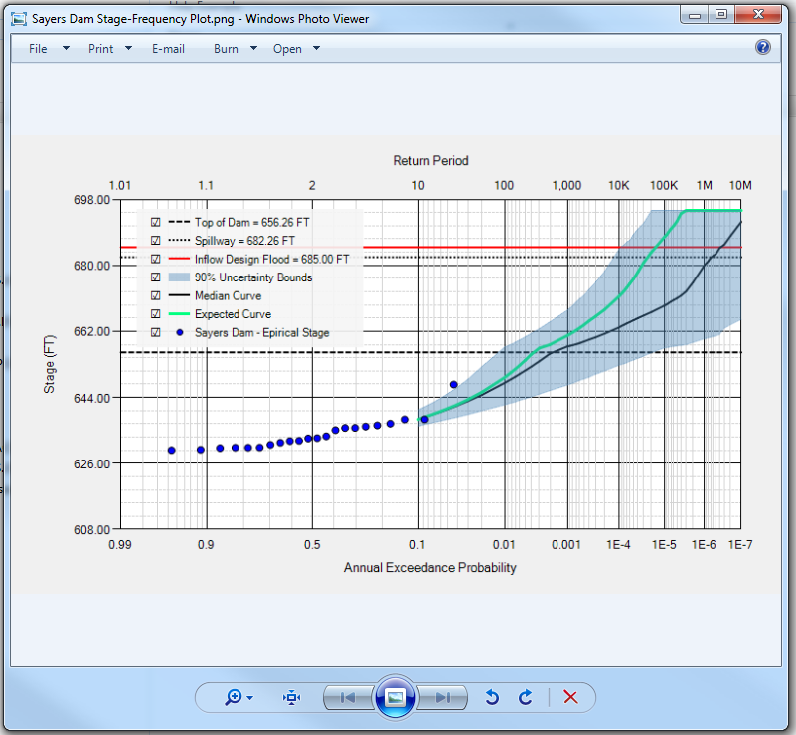
Chart Settings
Chart settings allows the user to add a title, change formatting, create a legend and edit the graph axes. Chart settings are reverted once the window is closed. To save a formatted chart, save chart image prior to closing the window.
Allows the user to enter a title, and change the font and size of the title.
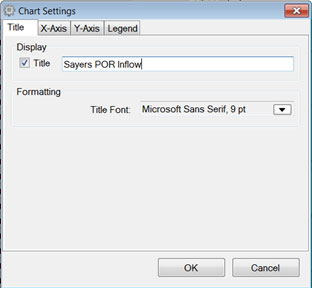
Figure: Plot title menu. Each display item has a formatting option which allows the user to change the font, style, size, and effects of the display writing.
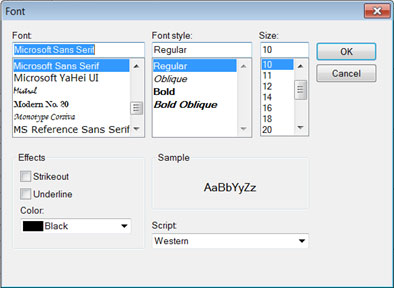
Figure: Font formatting options for plots. In addition to a title and formatting options, the axis settings allows the user to change the scaling on the axis.
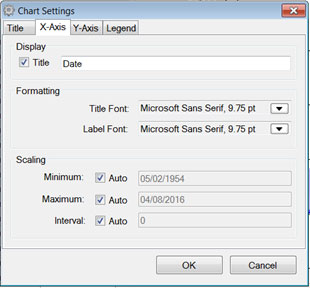
Figure: Chart settings, X and Y axis. You can specify the axis scale and tic interval for individual plots. If the check boxes next to Auto are checked, the plot will automatically select the scale. If you uncheck these boxes you can specify the minimum range, maximum range of the scale and the tic intervals.
On this tab you can add a plot legend to the graph, and specify the legend's font, alignment, and docking position.
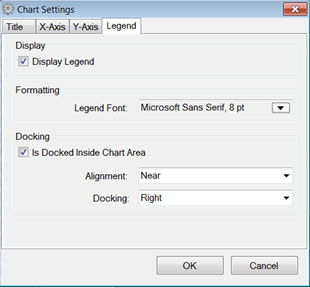
Figure: Legend settings. Click on the box in order to display the legend.
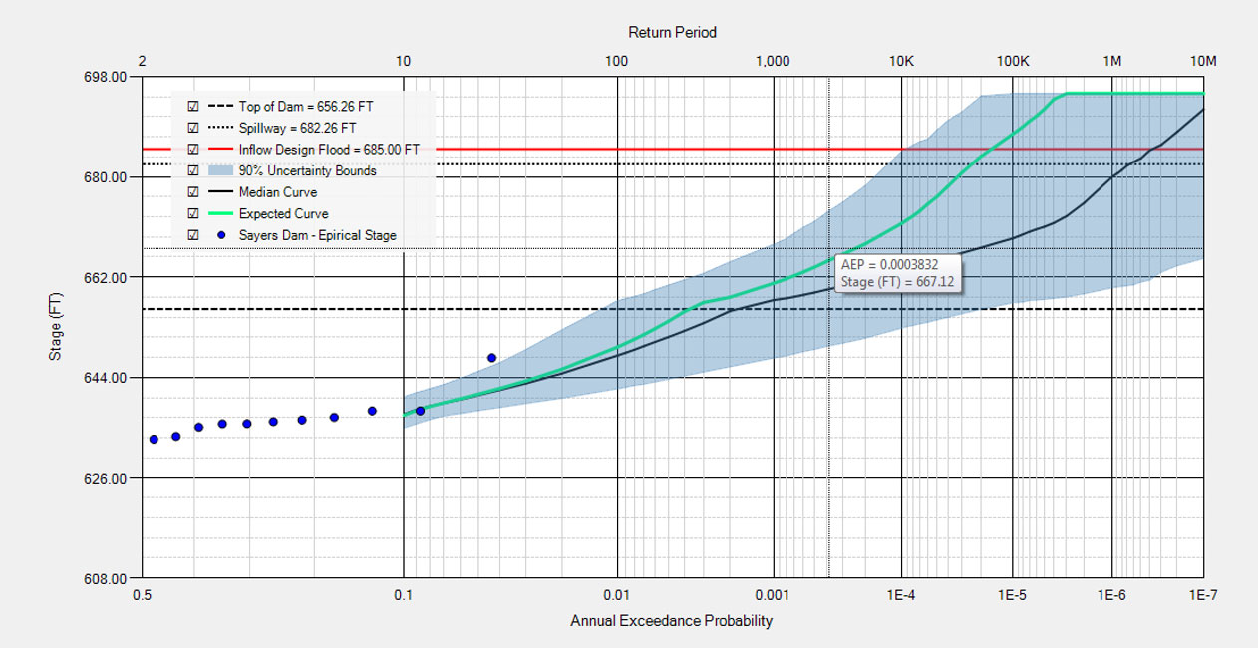
When a legend is on the plot, you can turn on or off a chart series by clicking the check box in the legend next to the chart series.
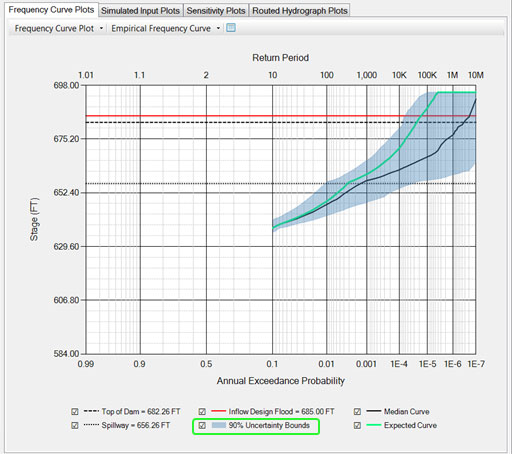
Figure: Plot with data turned on. 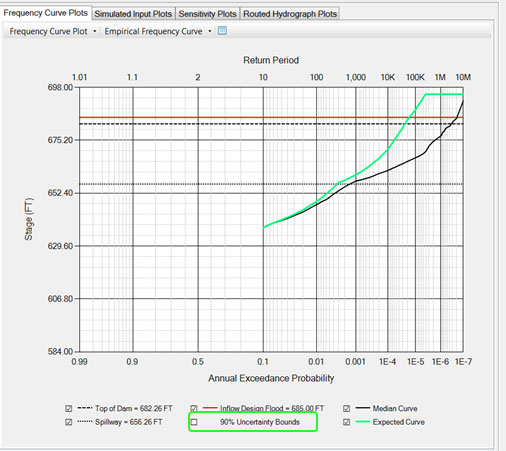
Figure: Plot with uncertainty bounds turned off.
Note: Manipulation of chart only works on the open session. Once a file or window is closed, the chart settings will revert to the default settings.
Message Window
The Message Window is where the program communicates with the user. Notes, warnings and errors will display here. These messages are useful for identifying why a simulation run failed, or why a requested action, like compute, was not completed.
There are three colors associated with the information displayed in the message window. Blue is associated with notes, orange indicates a warning, and red indicates an error.
