Graphical User Interface
RMC-BestFit is a menu-driven software package that performs distribution fitting and Bayesian estimation from a choice of thirteen probability distributions. The software features a fully integrated modeling platform, including a modern graphical user interface, data entry capabilities, distribution fitting analysis, Bayesian estimation analysis, and report quality charts.
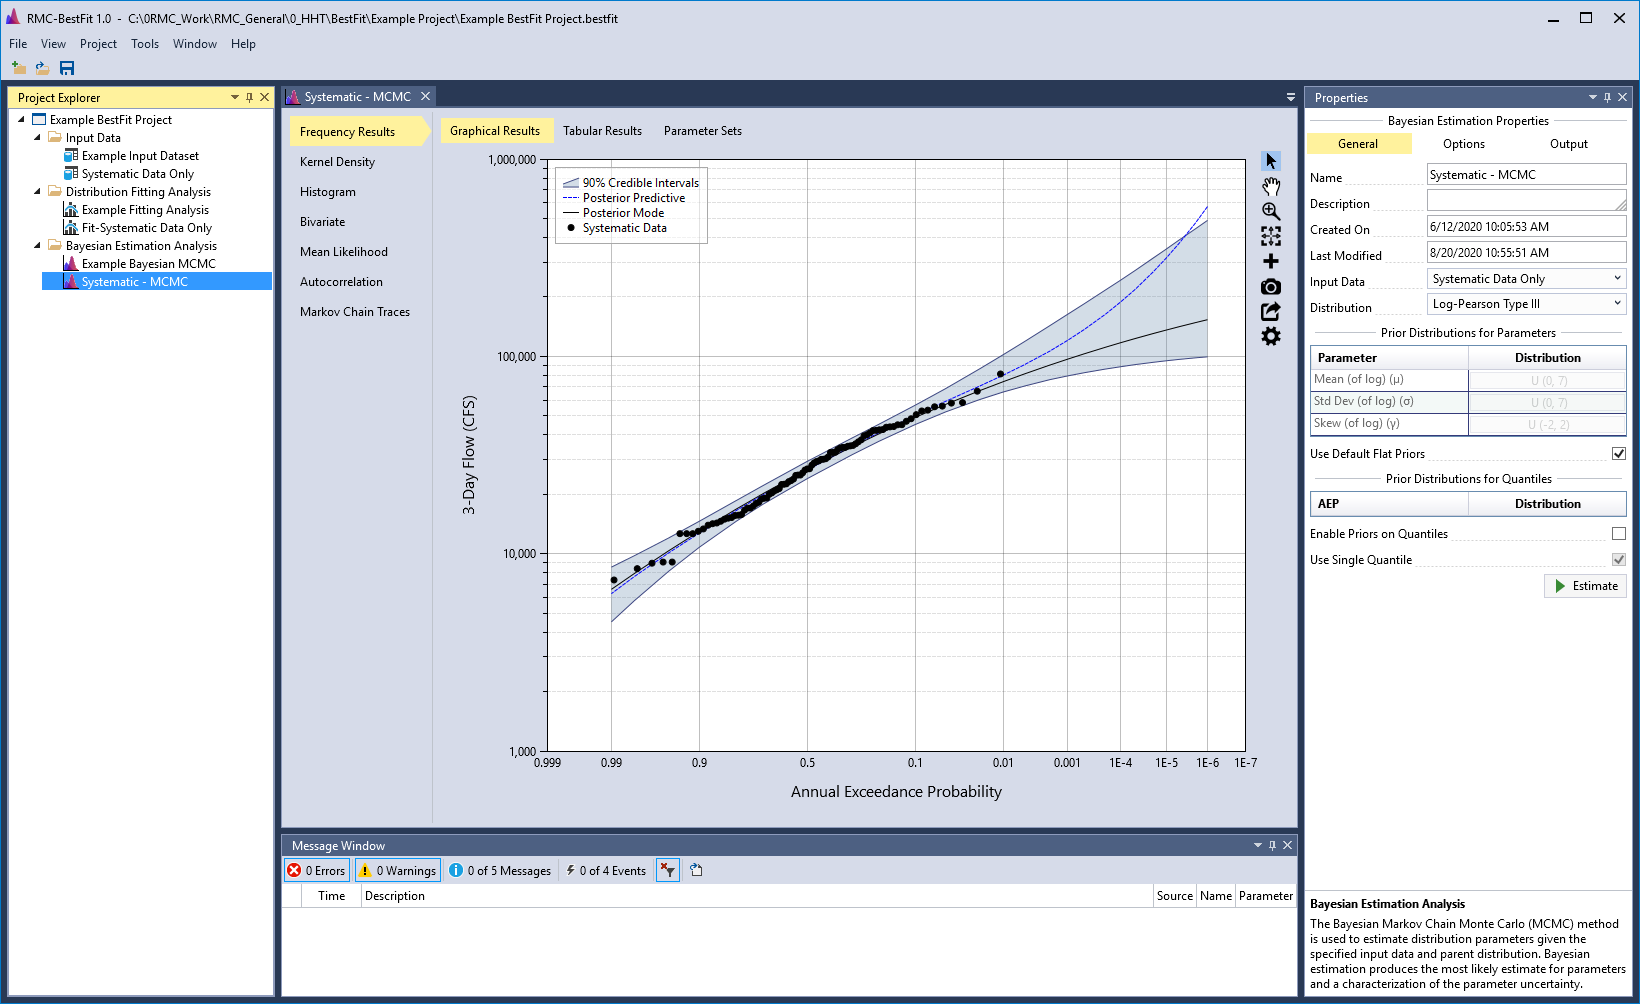
The graphical user interface consists of a Menu Bar, Tool Bar, and four window panes. Starting from the left in Figure and moving clockwise, the panes will be referred to as the Project Explorer, the Tabbed Documents, the Properties Window, and the Message Window. You may move, dock, hide, or close the window panes as desired.
Menu Bar
The menu bar located at the top of main window, as shown in Figure, contains important commands needed for working with RMC-BestFit. For example, the Project menu contains commands related to the project you are working in. On the Tools menu, you can customize how RMC-BestFit behaves by selecting Options…, or restore the project from a backup file by selecting Restore from Backup.
File
The File menu provides essential file management functionality. From this menu, you may create a new project, open an existing project, save or save as, open recent projects, or exit the application.
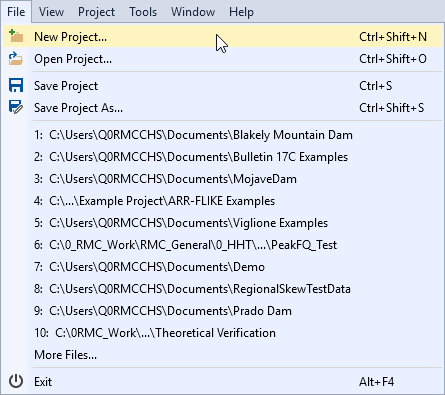
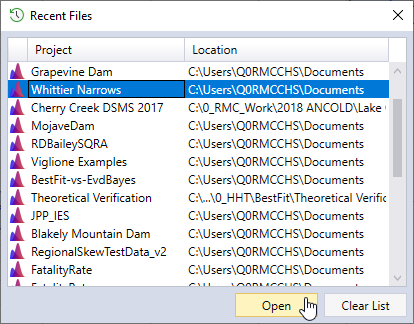
If this is the first time you're using RMC-BestFit, your recent projects list will be empty. Once you have exceeded the number of projects shown in the recent project list (the default is 10), a menu item labeled as More Files… will be available. After clicking this item, a Recent Files dialog will open showing all available recent project files (Figure). From here, you may open any recently used project file, or clear the recent project file list.
View
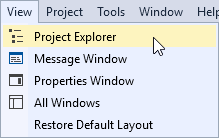
You may move, dock, hide, or close the Project Explorer, Properties Window, and Message Window as desired. The View menu allows you to unhide or open these windows. In addition, you can restore the default layout of the window panes.
Project
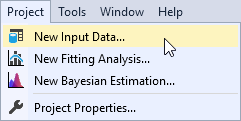
The Project menu contains commands related to the project you are working in. From this menu, you can create a new input data, distribution fitting analysis, or Bayesian estimation analysis. In addition, you can edit the project properties.
Tools
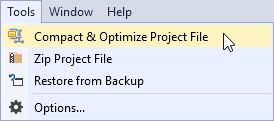
The Tools menu provides important tools for managing your project file. On the Tools menu, you can customize how RMC-BestFit behaves by selecting Options…, or restore the project from a backup file by selecting Restore from Backup. See the Personalize RMC-BestFit section for more details.
Window
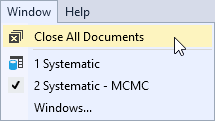
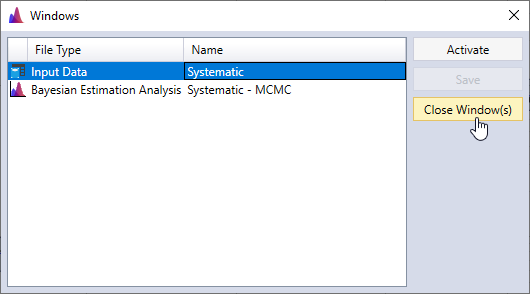
The Window menu allows you to close or activate the document windows. The active document will have a check mark next to it as shown in Figure. You can see all open windows by clicking Windows…, which will open a Windows dialog. From here, you can activate or save specific documents. In addition, you can select and close multiple documents at once.
Help
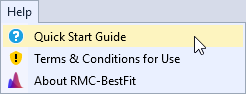
From the Help menu, you can access this Quick Start Guide, view the Terms & Conditions for Use, or view the About RMC-BestFit splash screen.
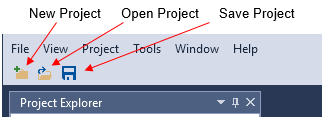
Tool Bar
The Tool Bar is located on the main window, below the Menu Bar. The buttons on the tool bar provide the most frequently used options under the File menu:
- New Project
- Open Project
- Save Project
Window Layout
In RMC-BestFit, you can customize the position, size, and behavior of windows to create window layouts that work best for you. When you customize the layout, RMC-BestFit will remember the configuration. For example, if you change the docking location of the Project Explorer and then close RMC-BestFit, the next time that you open the software, the Project Explorer will be docked in that same location.
Types of Windows
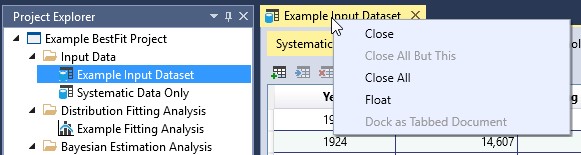
RMC-BestFit has two basic window types, tool windows and document windows. Tool windows include the Project Explorer, Properties Window, and Message Window. Document windows contain the project element files, such as input data, distribution fitting analyses, and Bayesian estimation analyses. The tool windows can be resized and dragged by their title bar, whereas the document windows can be dragged by their tab. On the tool windows title bar, there is a drop-down with other window options. Likewise, you can right-click on the document tab to set other options on the window. These options include docking, floating, and hiding windows.
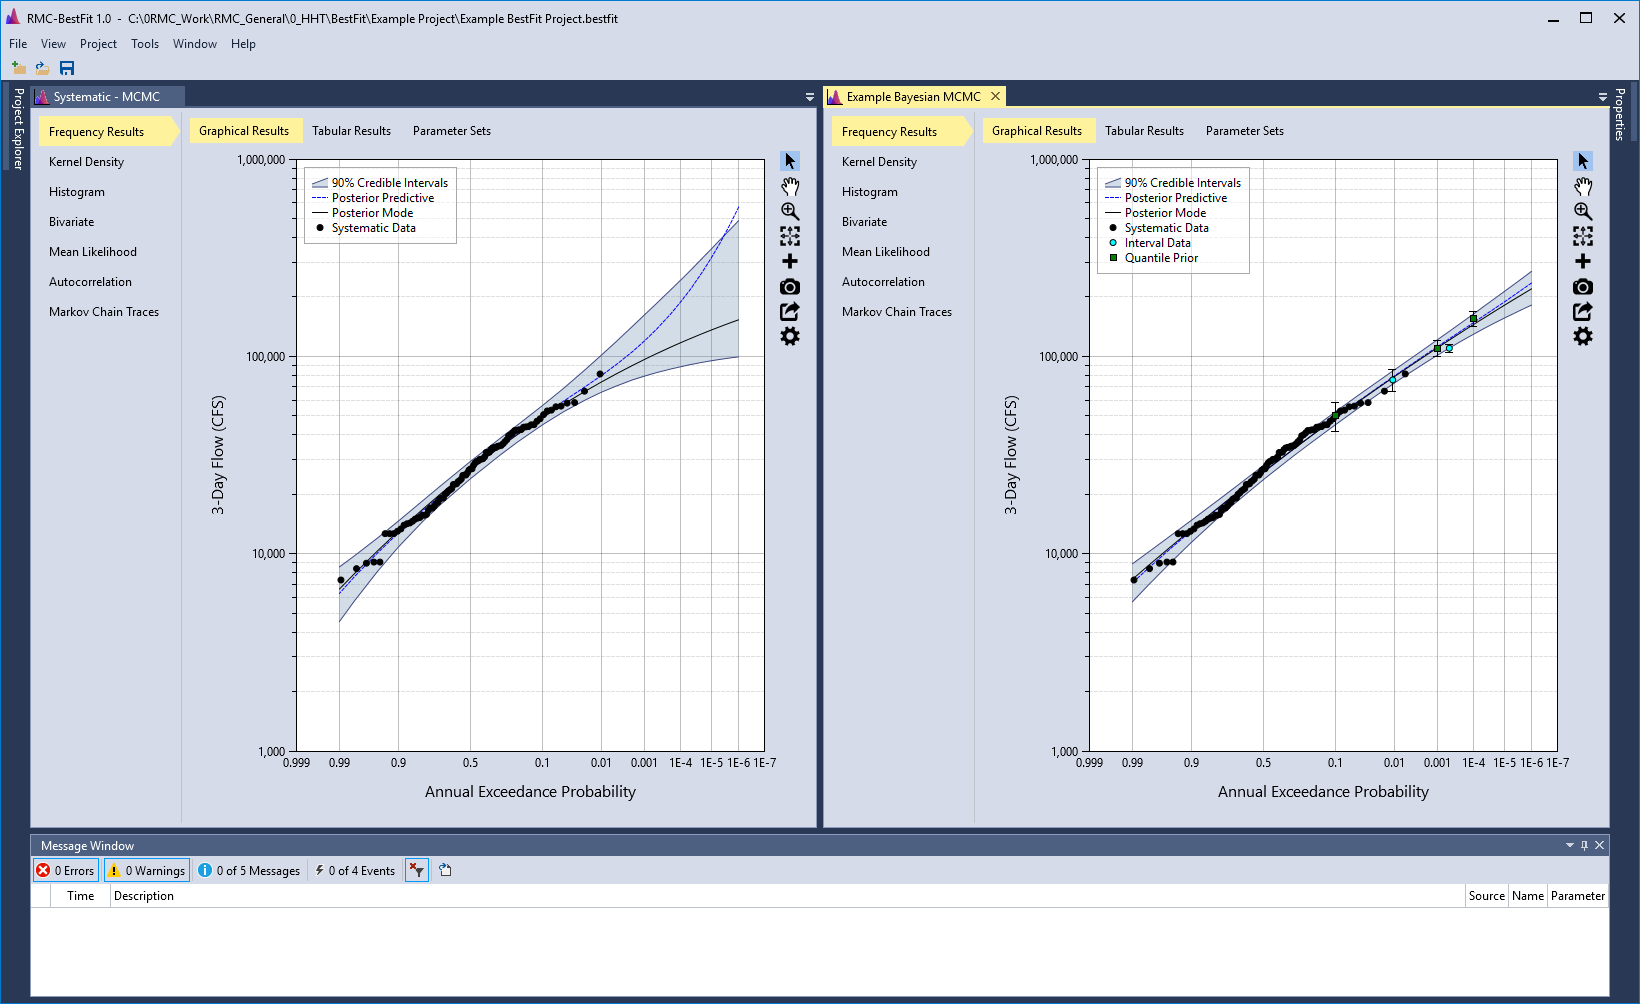
Tab Groups
The windows can be grouped together to enhance your ability to manage a limited workspace while you are working with two or more open documents in RMC-BestFit. You can organize multiple document windows and tool windows into either vertical or horizontal tab groups, or move documents from one group to another. The windows and tab groups can also be floated and moved to different monitors. When you need to view or edit two documents at once, you can split windows by creating two horizontal tab groups as shown below in Figure.
Arrange and Dock Windows
A document window can be docked, so that it will be located in the Tabbed Documents area, or the document can be floated as a separate window independent of the main window. You can arrange windows in the following ways:
- Dock tool windows to the edge of the main window frame.
- Float tool and document windows over or outside the main window.
- Hide tool windows along the edge of the main window.
- Display windows on different monitors.
- Reset window placement to the default layout by choosing View > Reset Default Layout.
Arrange windows by dragging or right-clicking the title bar or tab of the window to be arranged.
Dock Windows
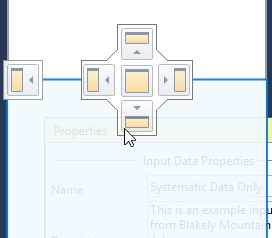
When you click and drag the title bar of a tool window, or the tab of a document window, a cross shaped window placement guide will appear. During the drag operation, when the mouse cursor is over one of the arrows in the guide, a shaded area will appear that shows you where the window will be docked if you release the mouse button. An example of the window placement guide is shown below in Figure and Figure.
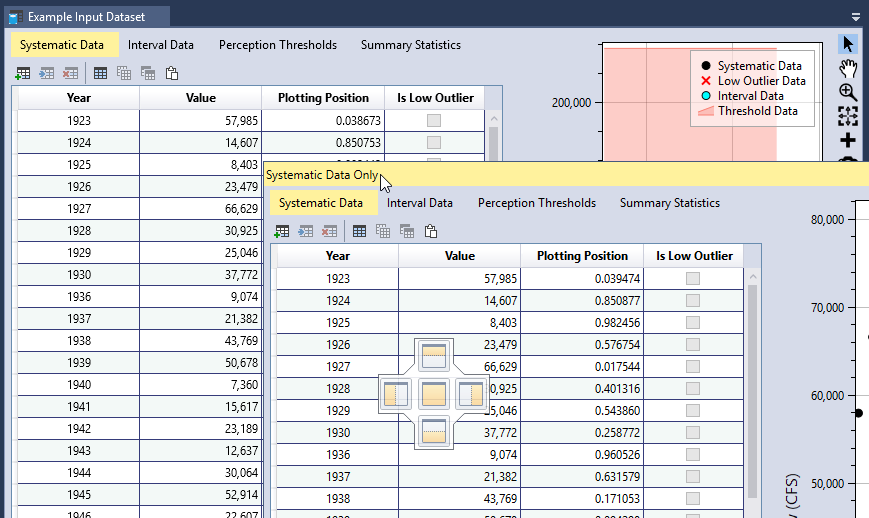
Figure shows the Properties Windows being docked below the Project Explorer. The new location is demarcated by the light blue shaded area.
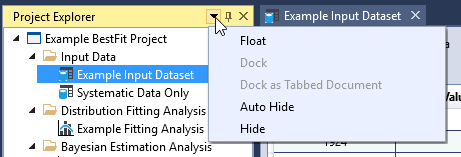
Close and Auto-Hide Tool Windows
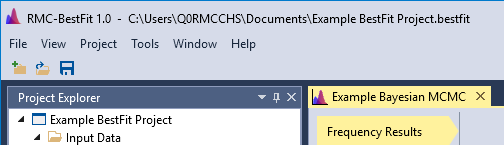
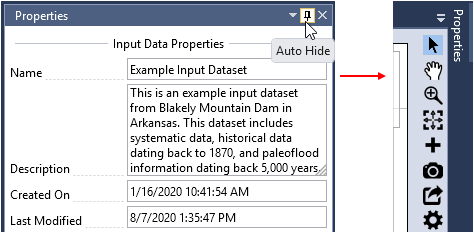
You can close a tool window by clicking on the X in the upper right of the title bar. To reopen the tool window, navigate to the View menu and select the desired tool window to show. Tool windows have an auto-hide feature, which causes a window to slide out of the way when you use a different window. When a window is auto-hidden, the window name appears on the tab at the edge of the main window as shown in Figure. To show the window again, move your mouse cursor over the tab so that the window slides back into view.
Project Explorer
The Project Explorer, which is typically on the left-hand side of the main window, shows a graphical representation of the hierarchy of elements within your project. After you create a new project, you can use the Project Explorer to view, navigate, and manage the project elements.
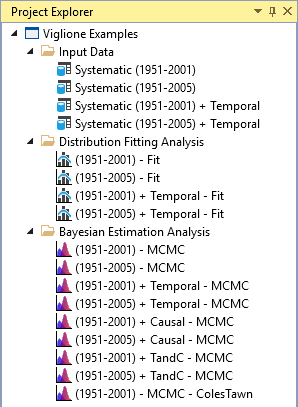
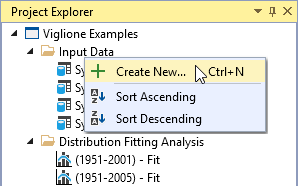
Project elements are organized under the Input Data, Distribution Fitting Analysis, and Bayesian Estimation Analysis folder headers. Many menu commands are available from the right-click menu on various items in the Project Explorer. You can create new elements, or sort the element collections, by right-clicking the header.
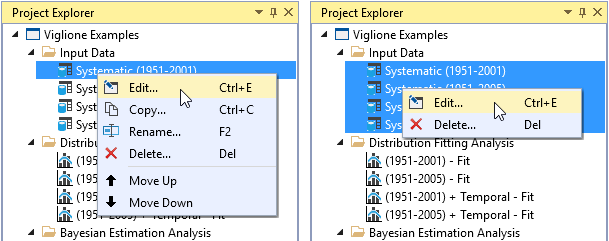
When right-clicking an individual project element, the following commands are made available: edit, copy, rename, delete, move up, and move down. When multiple project elements are selected, only two right-click menu commands are available: edit and delete. Double-clicking a project element will open it for editing.
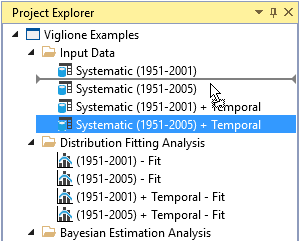
You can move individual project elements within a collection by left-clicking and dragging the element. A mouse cursor adornment will appear indicating where the element will be moved, as shown in Figure. You can also drag and drop Input Data from one RMC-BestFit project to another.
Tabbed Documents
In RMC-BestFit, document windows contain the project element files, such as input data, distribution fitting analyses, and Bayesian estimation analyses. When you open a project element for editing, it will automatically open into the tabbed document group, which is typically located in the center of the main window (see Figure). You can reorder the tabbed documents, drag, or float them outside of the main window. When you click on, or activate, a document window, the associated project element properties will be shown in the Properties Window.
Properties Window
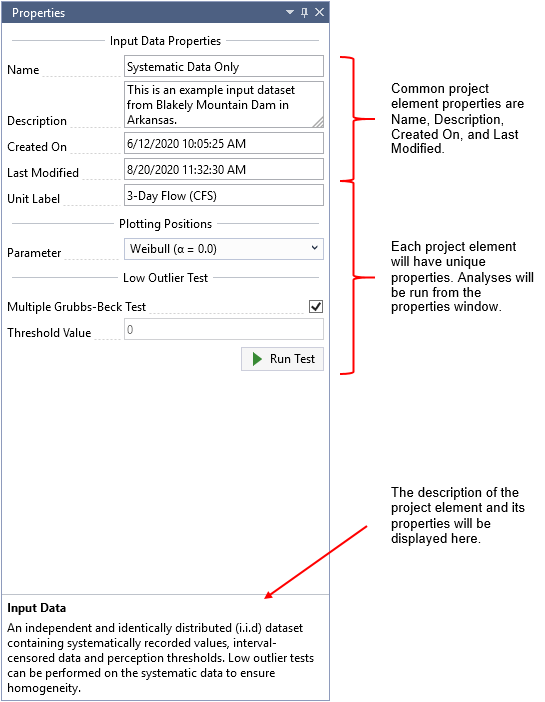
The Properties Window, which is typically on the right-hand side of the main window, displays the properties for the project and project elements. To access the element properties, first open the element for edit, then click on, or activate, the associated tabbed document. Some properties are common among all project elements, such as Name and Description, while others are unique to the specific elements. Properties are organized into groups for easier navigation. When you click on a property, the property description will be placed at the bottom of the properties window as shown in Figure. All analyses will be run from the properties window.
Message Window
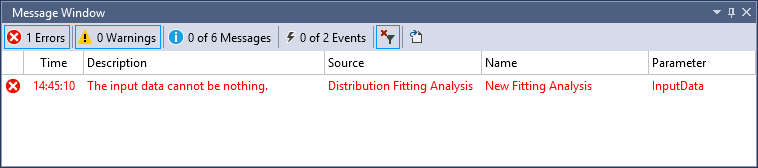
The Message Window shows you errors, warnings, messages and event logs regarding the current state of your project. If there are any errors in your project file, they are listed here. The Message Window lets you perform the following tasks:
- Display the errors, warnings, messages, and events produced while you work in RMC-BestFit.
- Double-click any error message entry to open the project element where the problem occurs.
- Filter the type of entries that are displayed in the Message Window. The default is to only display errors and warnings.
- Export all entries to a text file.
Once you resolve an error, warning, or message, the entry will be removed from the Message Window. You may customize the font color of the various message types by navigating to Tools > Options. See the Personalize RMC-BestFit section for more details.
Personalize RMC-BestFit
You can personalize RMC-BestFit in various ways to enhance the user experience by navigating to Tools > Options. The Options dialog allows the user to customize the Application, File Management, Message Window, and Default settings.
Application Options
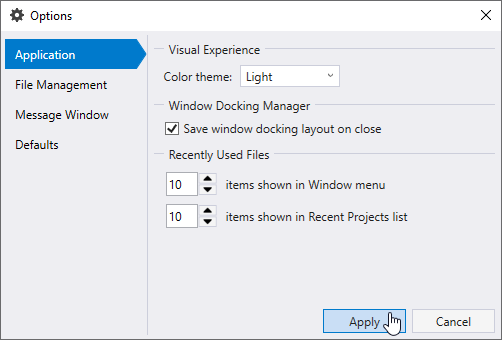
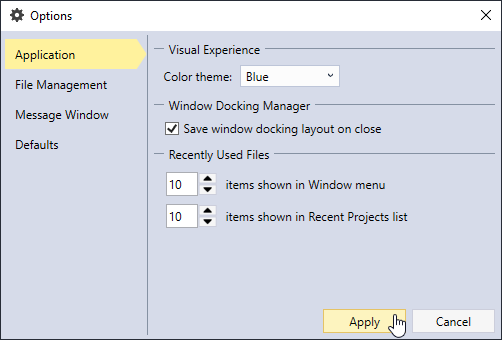
You can set the application color theme to be the Light theme or Blue theme as shown in Figure and Figure. The default is set to the Light theme. You can choose whether or not to Save the window docking layout on close so that RMC-BestFit will remember it when you reopen the application. You can also set the number of window items shown in the Window menu and the number of recent project items shown in the Recent Project list under the File menu.
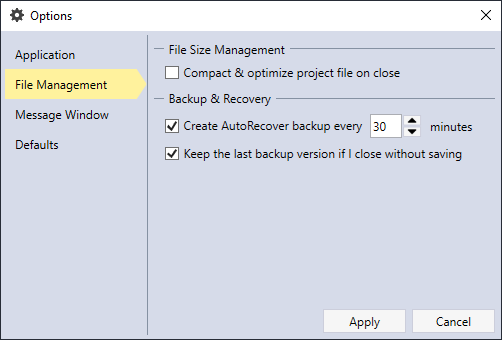
File Management Options
RMC-BestFit project files are saved as SQLite databases. SQLite is a self-contained, high-reliability, SQL database engine, which is also the most used database engine in the world (https://www.sqlite.org/). Database files can grow quickly as you use them, sometimes hindering performance. They can also occasionally become corrupt or damaged. You can use the Tools > Compact & Optimize Project File command to prevent or fix these problems. You can also set RMC-BestFit to Compact & optimize project file on close.
You can set the time interval in which a project backup file is created. A file with the extension .bak is automatically created when a project is opened. If the project closes successfully, then the .bak file is deleted. The database file can be damaged or corrupted, or the system could close unexpectedly causing you to lose important data, so on occasion, you might need to restore the project from a backup file by selecting Tools > Restore from Backup.
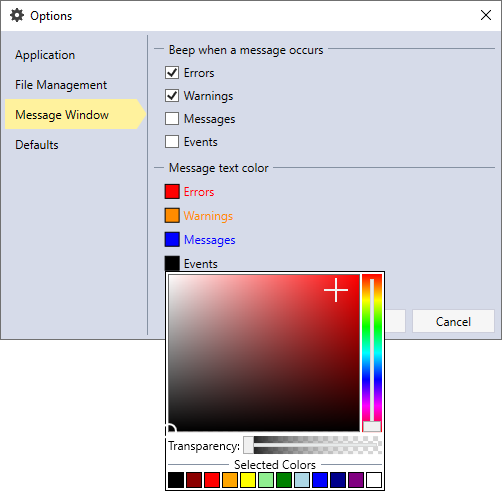
Message Window Options
You can adjust the auditory and visual setting for the Message Window. You can choose to turn on or off the beep sound effect and select the font color for the different message types, as shown below in Figure.
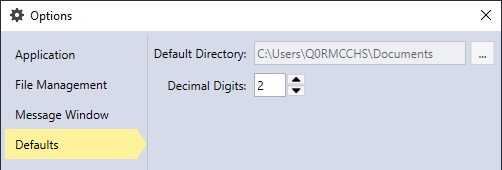
Default Options
You can set the default project location directory, and the default decimal digits for the project inputs and outputs.
Plot Features
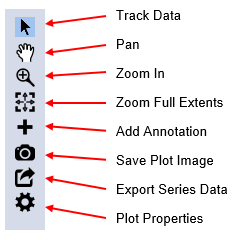
RMC-BestFit has plot features which allow you to examine the plot data and customize the plots for reporting purposes. There is a tool bar located to the right of each plot, which allows you to interact with the plot in the following ways:
- Track data to get the X-Y point values.
- Pan the plot up and down or side to side.
- Zoom in to the plot data.
- Zoom out to the plot extents.
- Add annotations to the plot.
- Save the plot image as a PNG, PDF, or SVG file.
- Export plot series data to a Comma Separated (.csv), Excel (.xlsx), or SQLite (.sqlite) file.
- Change the plot properties to create a customized appearance. The changes to the plot properties are saved and persist when you open and close the project and project element.
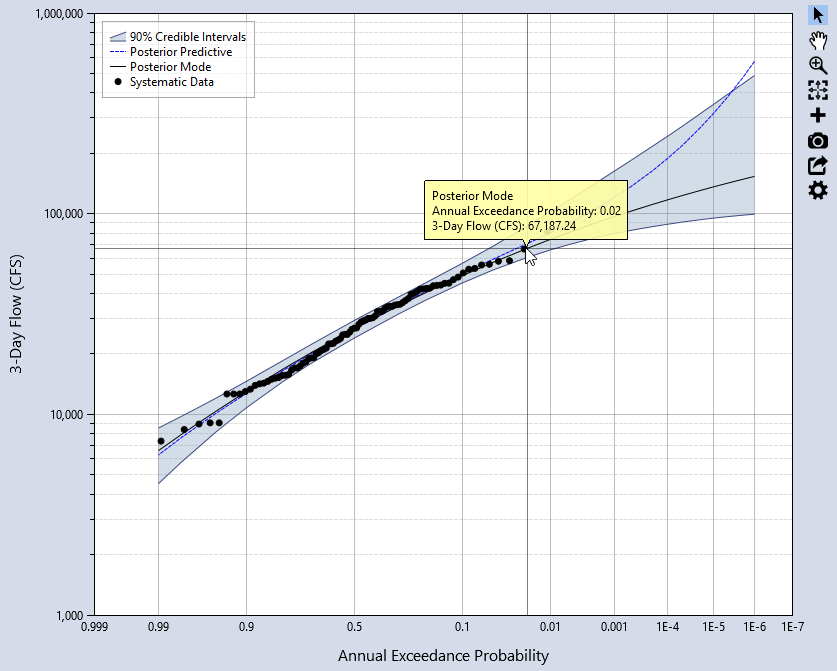
Track Data
The Track Data mouse pointer disables all other plot features when selected. Click on any plotted point or line in the graph to show a tooltip displaying the plot series name and X and Y data points.
Pan
The Pan feature allows you to navigate through the plot by clicking and dragging on the graph. The plot can be panned in any direction, up, down, and side to side.
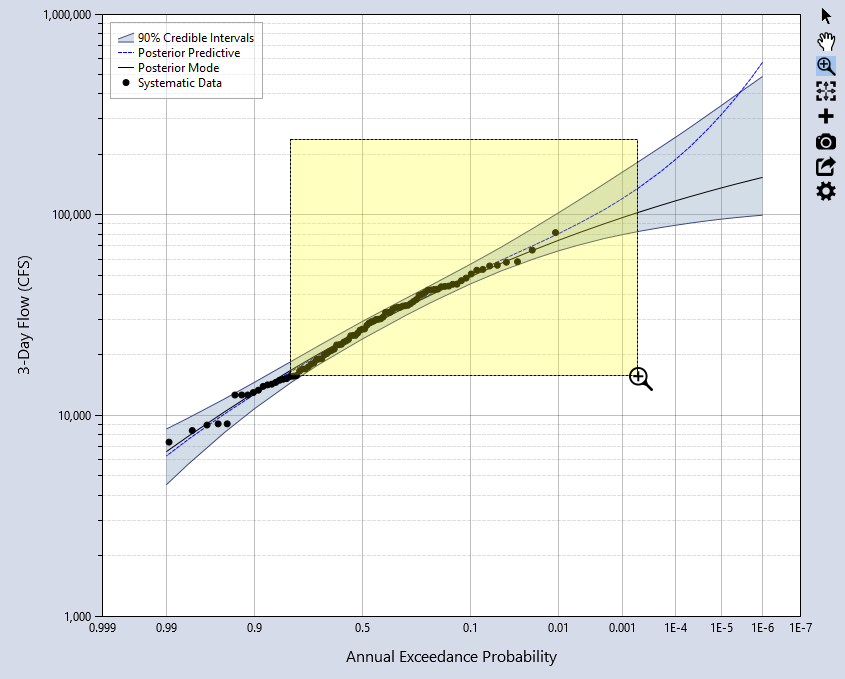
Zoom
You can Zoom In on the plot to view data more precisely at smaller intervals. Zooming works by highlighting the area of interest with the magnifying glass cursor (see Figure), or by zooming in and out using the mouse wheel. When you zoom in on the plot you may also Pan the plot area. To zoom all the way back out, click the Zoom to Extents button on the plot tool bar.
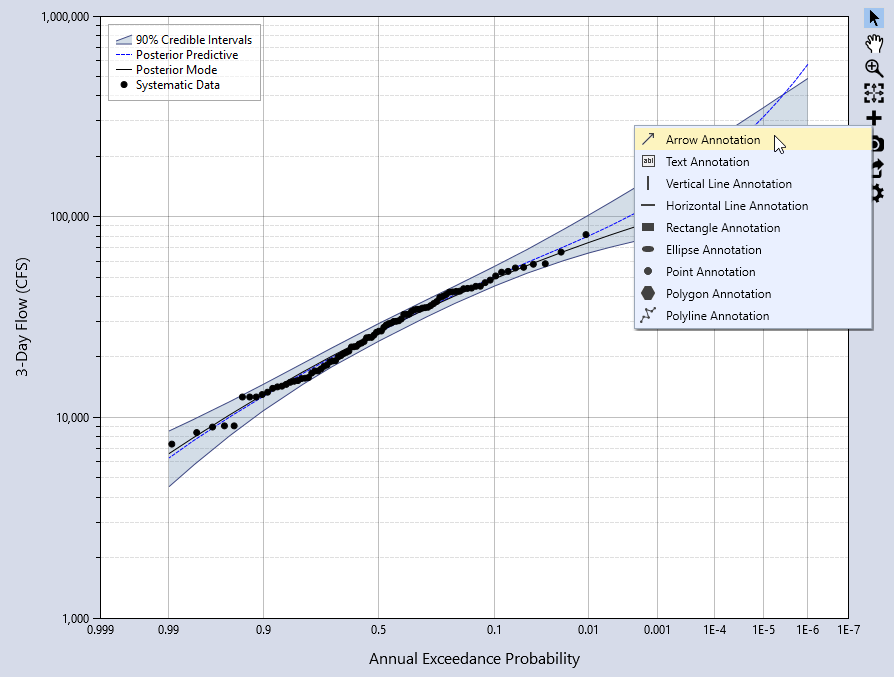
Add Annotation
Annotations are elements of the plot that show information that is not part of a plot series. Annotations are not included in the legend and not used by the tracker. You may add the following annotation types to the plot:
- Arrow
- Text
- Vertical Line
- Horizontal Line
- Rectangle
- Ellipse
- Point
- Polygon
- Polyline
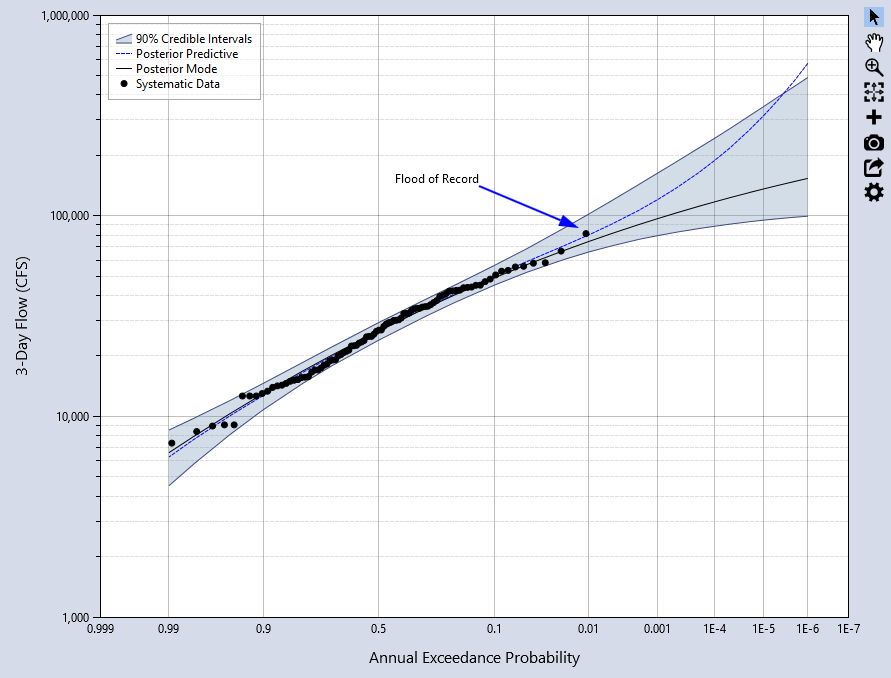
The annotations can be moved by clicking and dragging them to a new spot. An example of adding an arrow annotation is shown in Figure and Figure.
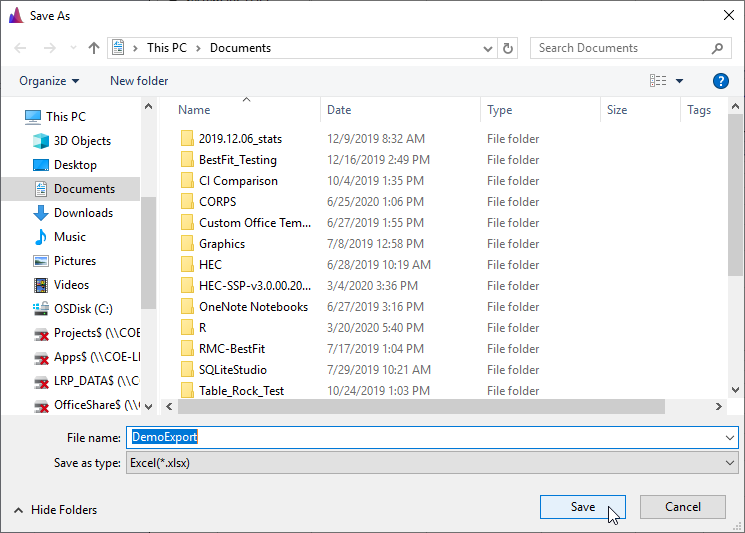
Export Series Data
The plot series data can be exported to a Comma Separated (.csv), Excel (.xlsx), or SQLite (.sqlite) file. After clicking the Export Series Data button, a Save As dialog will open. Select the desired file type and give the file a name, then click save. If the data is exported to a Comma Separated file, each plot series will be stored in separate columns. Whereas, if the data is exported to Excel, the series data will be stored on separate worksheet tabs. Likewise, if the data is exported to SQLite, the series data will be stored in separate tables.
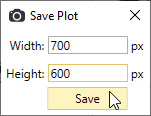
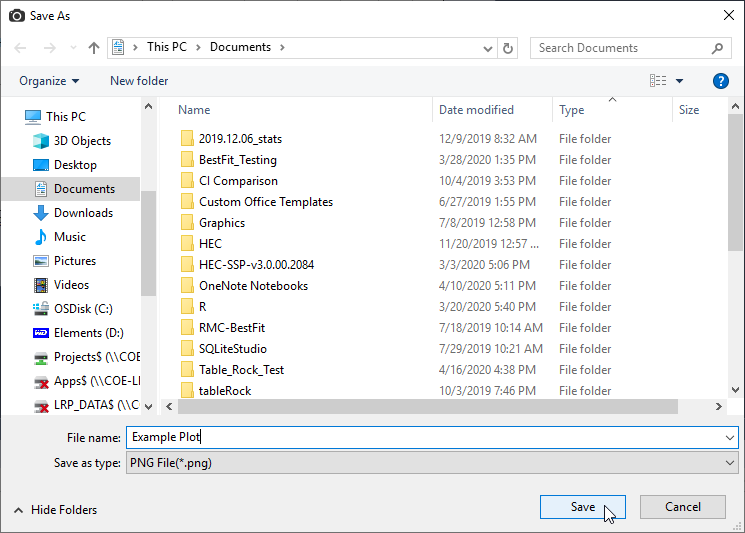
Save Plot Image
The plot image can be saved as a PNG, PDF, or SVG file. Before saving, you can set the width and height of the image. After the Save As dialog opens, give the plot image a name and click save.
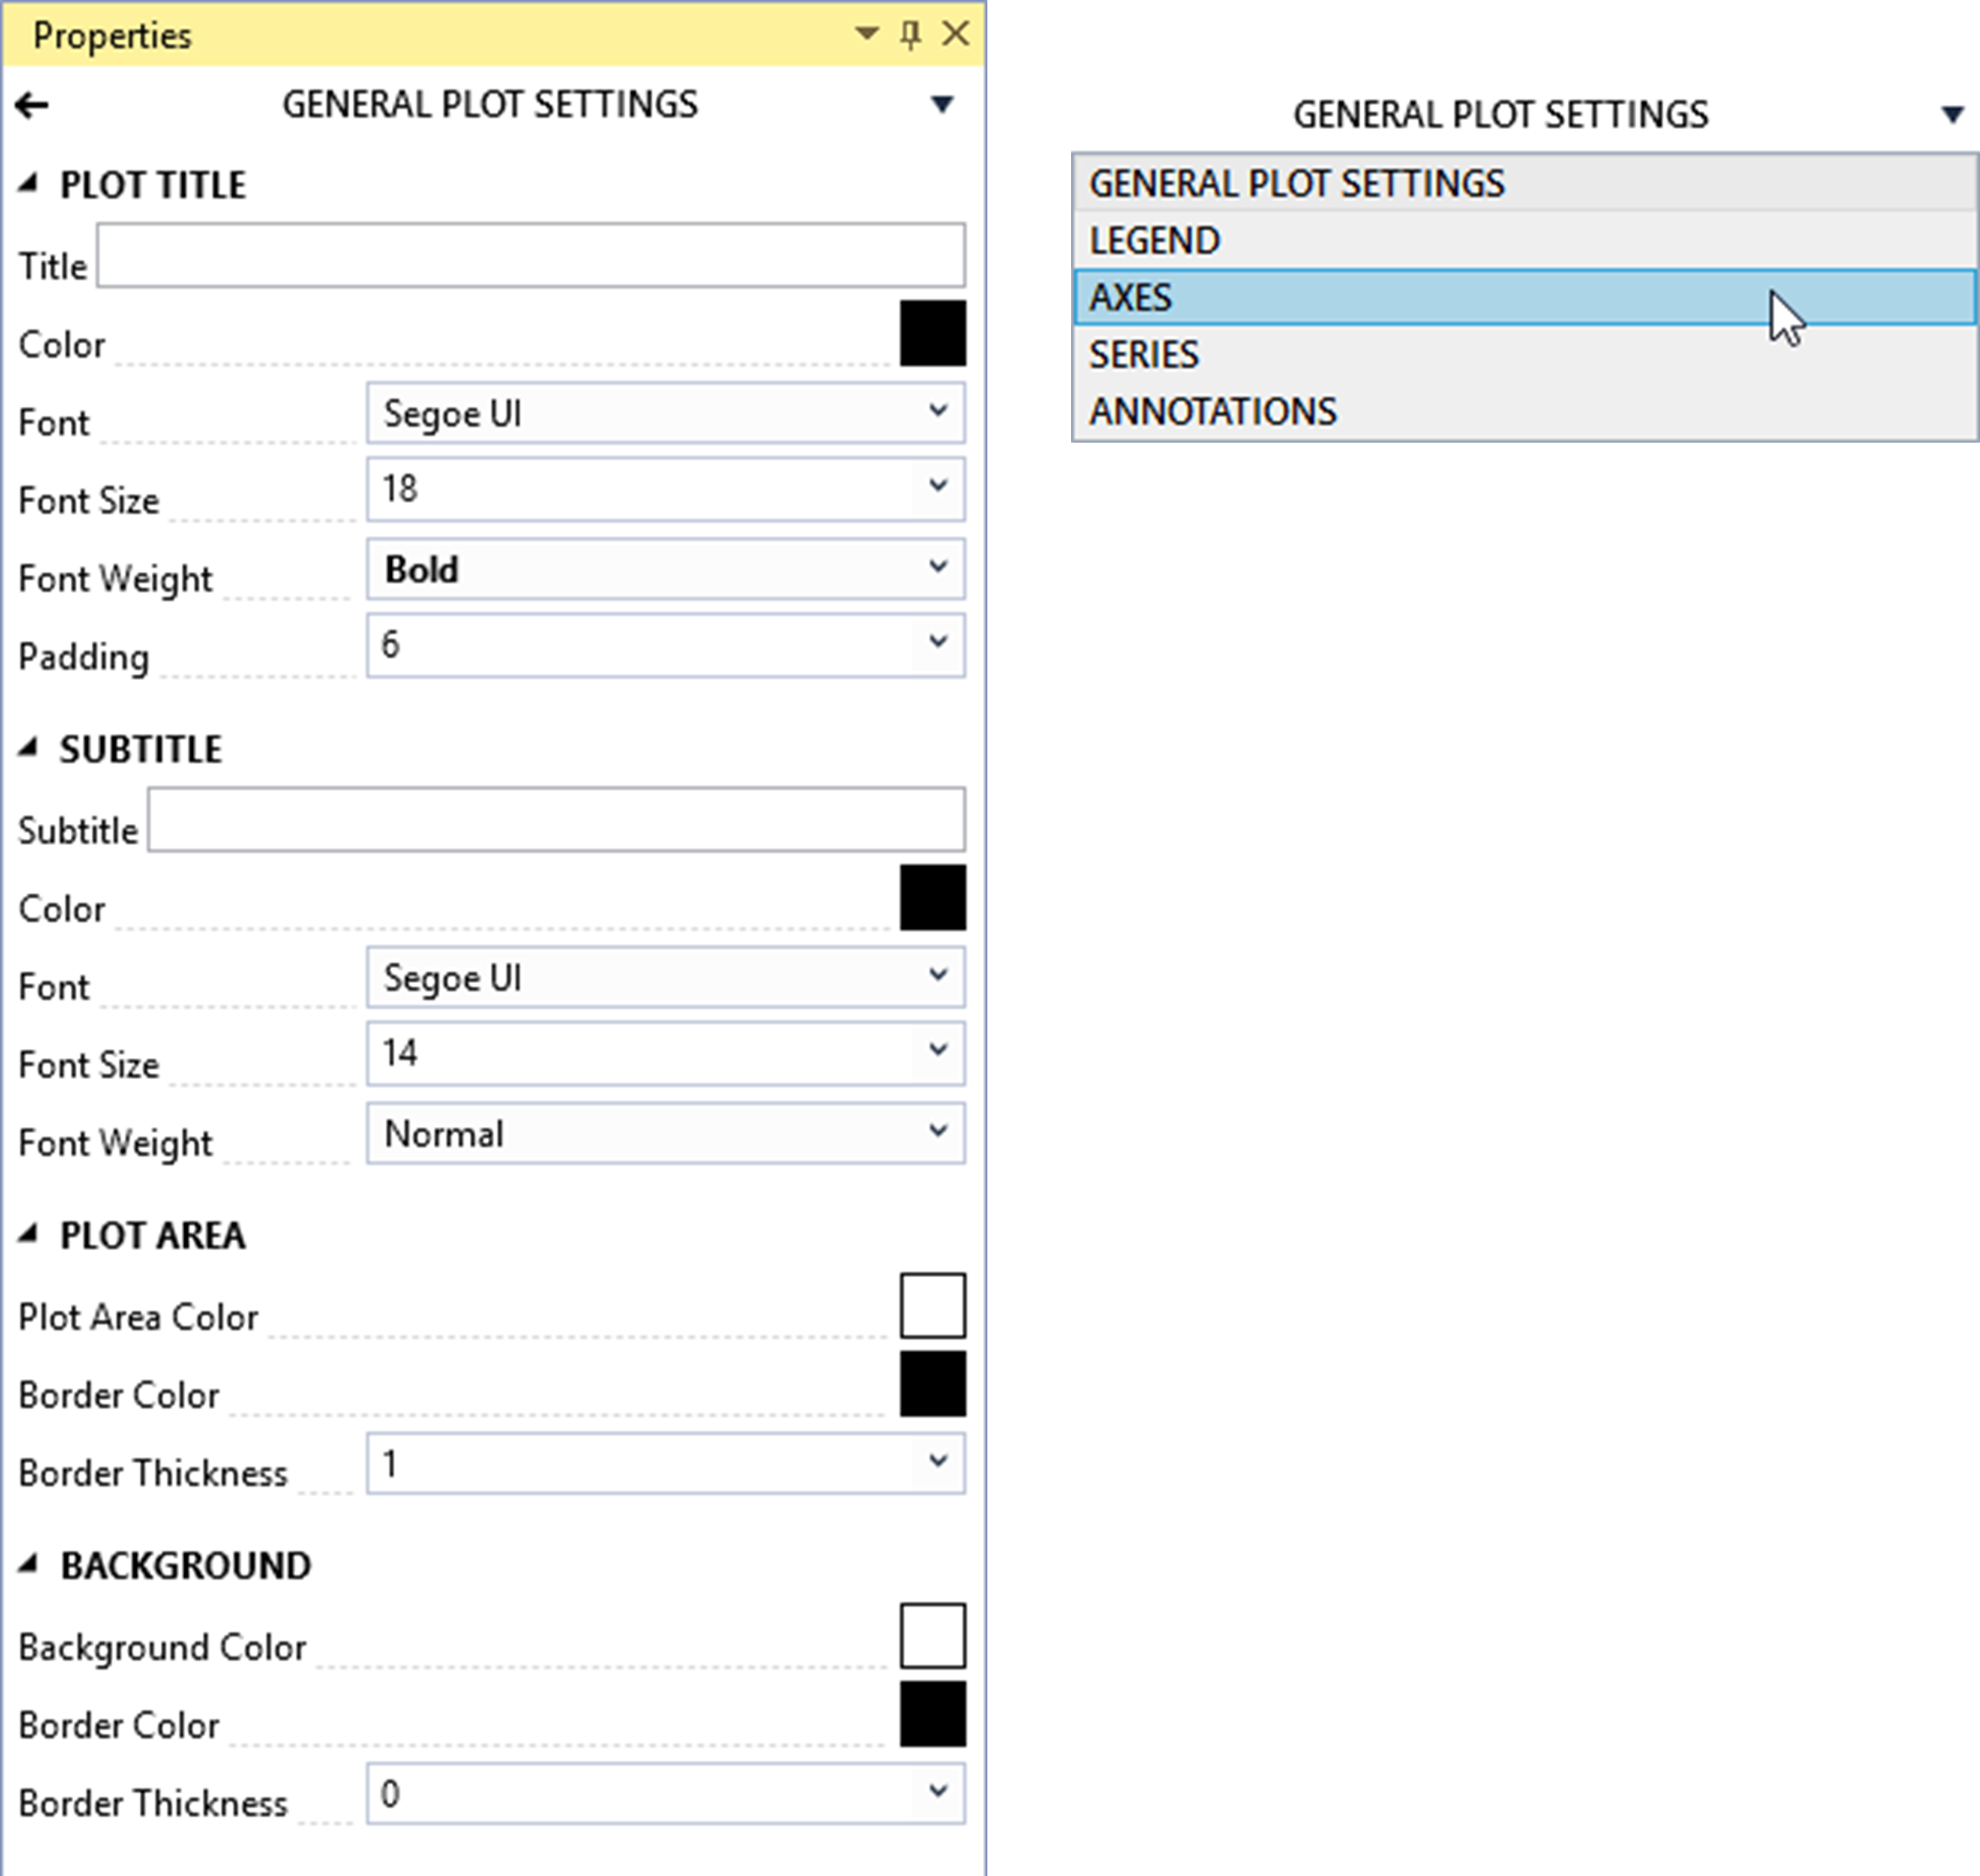
Plot Properties
You can edit the Plot Properties by clicking the gear wheel button in the plot tool bar. The plot properties will open in the Properties Window. From here, you can edit the general plot settings, legend, axes, series, and annotations. The plot properties will open to the General Plot Settings by default. Click the chevron in the upper right to open a drop down showing the other plot elements to edit.