Daily stage data from Water Year 1980-2024.
Format
A data frame with 29,858 rows and 4 columns:
- timestep
Timestep index
- date
Date
- time
Time
- stage_ft
Reservoir stage (FT-NAVD88)
Examples
sapply(jmd_wy1980_stage,class)
#> timestep date time stage_ft
#> "integer" "character" "character" "numeric"
head(jmd_wy1980_stage)
#> timestep date time stage_ft
#> 1 1 10/1/1979 0:00 3790.68
#> 2 2 10/2/1979 0:00 3790.64
#> 3 3 10/3/1979 0:00 3790.60
#> 4 4 10/4/1979 0:00 3790.60
#> 5 5 10/5/1979 0:00 3790.61
#> 6 6 10/6/1979 0:00 3790.61
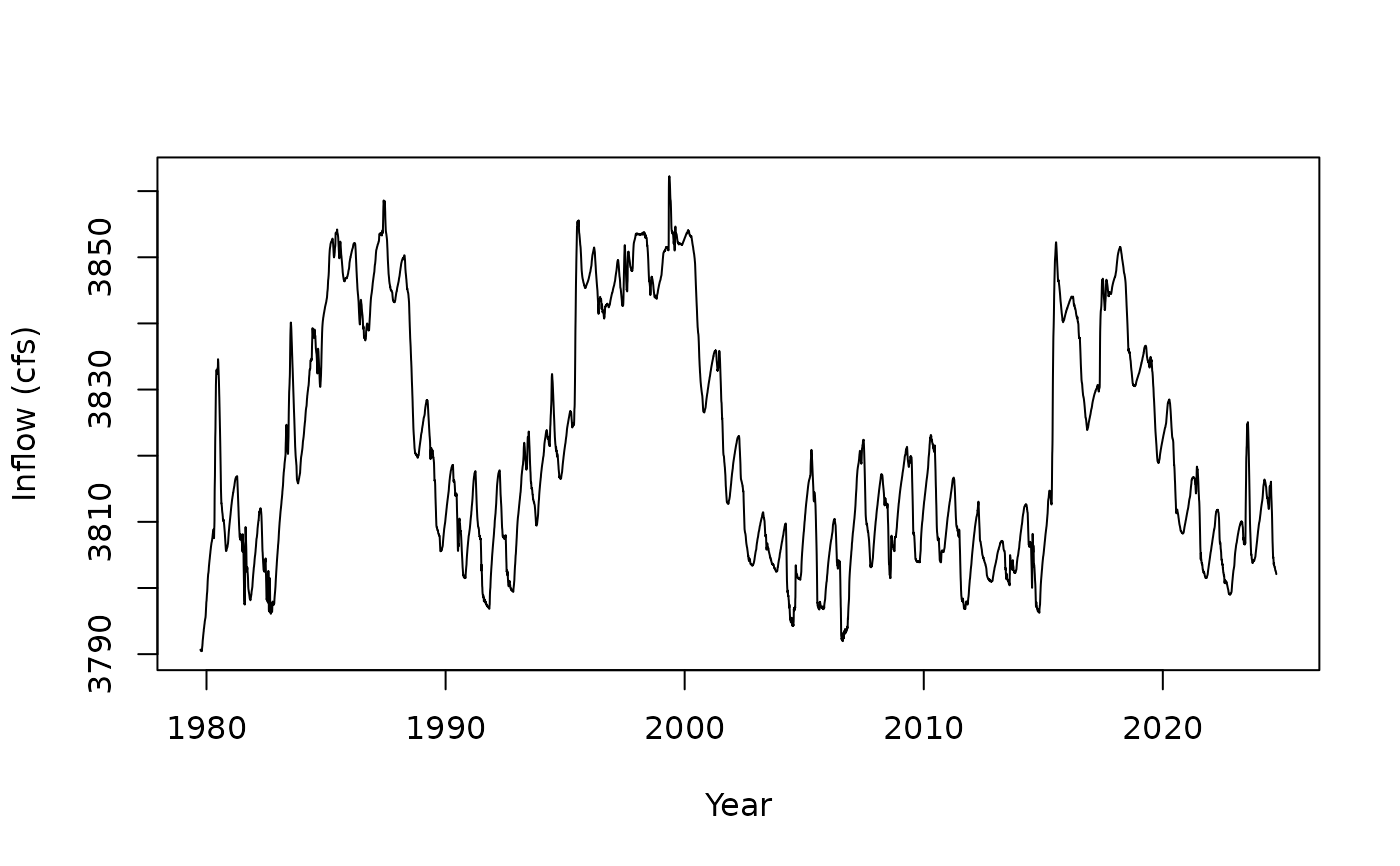
plot(as.Date(jmd_wy1980_stage$date,tryFormats = c("%m/%d/%Y")), jmd_wy1980_stage$stage_ft,
xlab = "Year", ylab = "Inflow (cfs)",
type = "l")