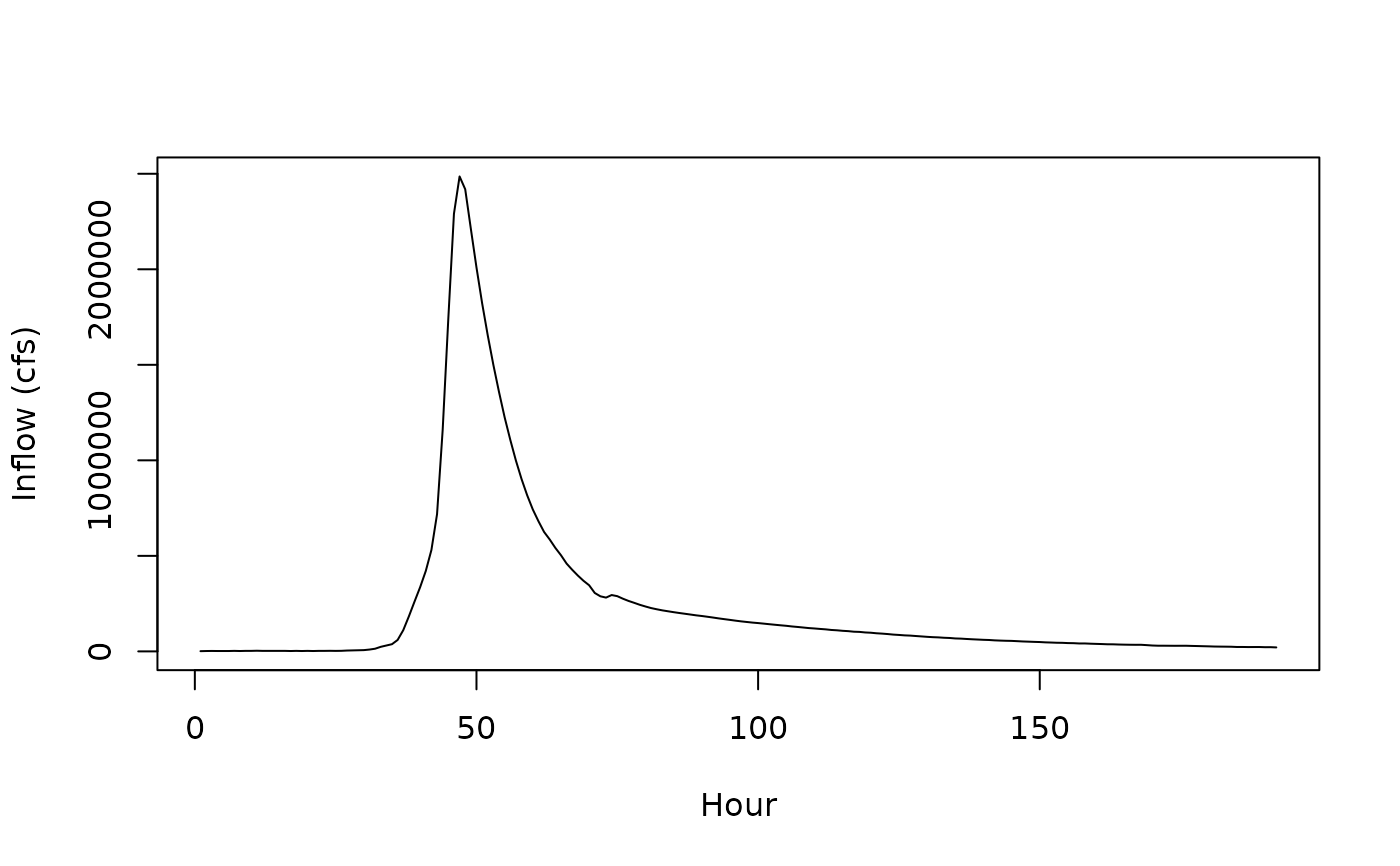
Inflow hydrograph shape for Probable Maximum Flood (PMF).
Format
A data frame with 192 rows and 4 columns:
- Ordinate
Timeseries Ordinate
- Date
Date mm/dd/yyyy
- Time
Time in 00:00
- Flow
Inflow (cfs)
Examples
sapply(jmd_hydro_pmf, class)
#>    Ordinate        Date        Time        Flow
#>   "integer" "character" "character"   "integer"
head(jmd_hydro_pmf)
#>   Ordinate     Date Time Flow
#> 1        1 2/2/2099 0:00 1131
#> 2        2 2/2/2099 1:00 1890
#> 3        3 2/2/2099 2:00 2277
#> 4        4 2/2/2099 3:00 1936
#> 5        5 2/2/2099 4:00 1934
#> 6        6 2/2/2099 5:00 1933
plot(jmd_hydro_pmf$Ordinate, jmd_hydro_pmf$Flow,
     xlab = "Hour", ylab = "Inflow (cfs)",
     type = "l")