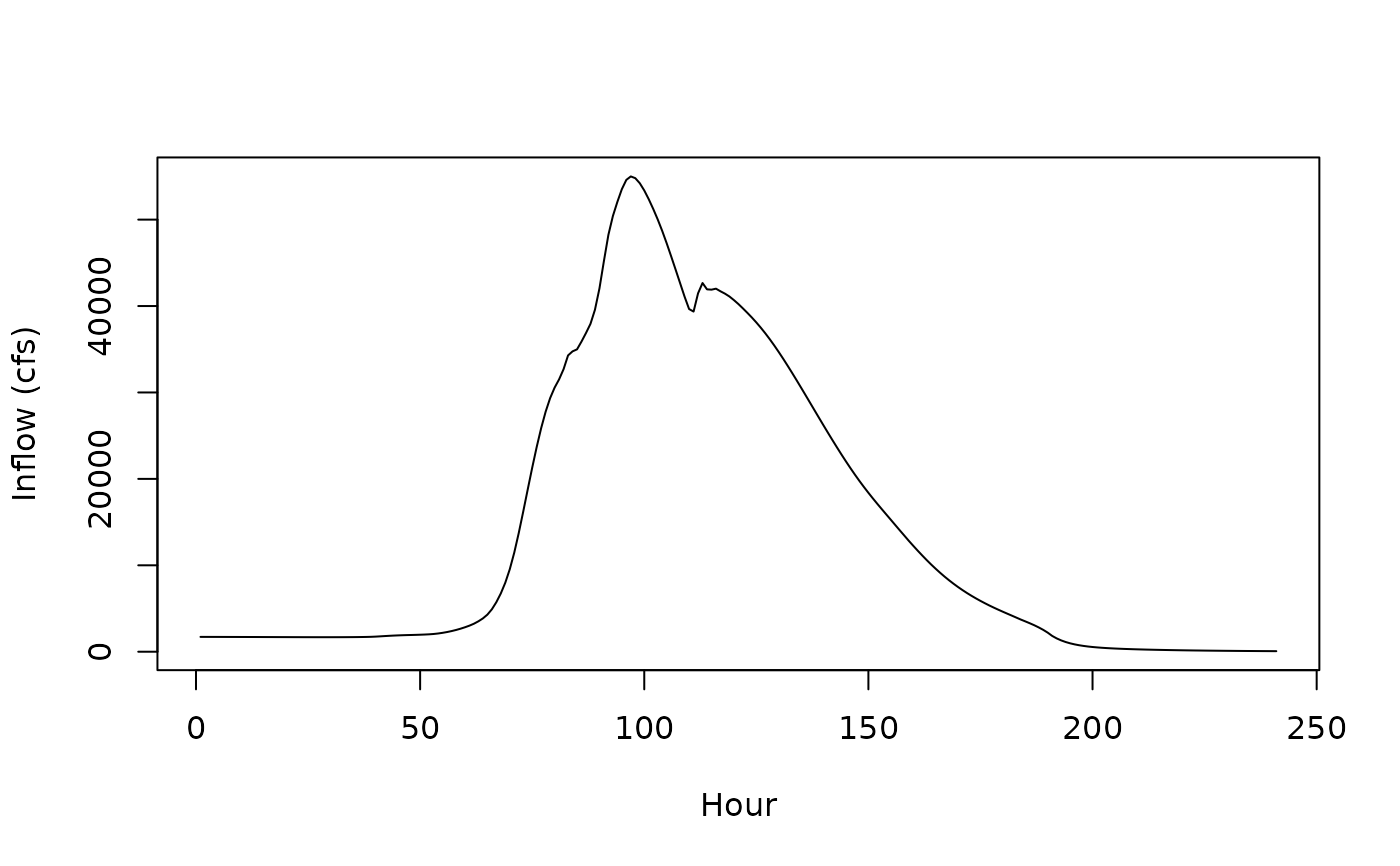
Inflow hydrograph shape from June 1965 flood event (from HEC-HMS).
Format
A data frame with 241 rows and 4 columns:
- Ordinate
Timeseries Ordinate
- Date
Date mm/dd/yyyy
- Time
Time in 00:00
- Flow
Inflow (cfs)
Examples
sapply(jmd_hydro_jun1965,class)
#>    Ordinate        Date        Time        Flow
#>   "integer" "character" "character"   "integer"
head(jmd_hydro_jun1965)
#>   Ordinate      Date Time Flow
#> 1        1 6/15/1965 0:00 1717
#> 2        2 6/15/1965 1:00 1716
#> 3        3 6/15/1965 2:00 1715
#> 4        4 6/15/1965 3:00 1714
#> 5        5 6/15/1965 4:00 1713
#> 6        6 6/15/1965 5:00 1712
plot(jmd_hydro_jun1965$Ordinate, jmd_hydro_jun1965$Flow,
     xlab = "Hour", ylab = "Inflow (cfs)",
     type = "l")