LP3 distribution parameters sets of volume-frequency curve results from RMC-BestFit 2.0.
Format
A data frame with 10000 rows and 3 columns:
- mean_log
Mean of log-transformed values
- sd_log
Standard deviation of log-transformed values
- skew_log
Skewness of log-transformed values
- log_likelihood
Log-likelihood of parameter set
Examples
sapply(jmd_bf_parameter_sets,class)
#> mean_log sd_log skew_log log_likelihood
#> "numeric" "numeric" "numeric" "numeric"
jmd_bf_parameter_sets[sample(nrow(jmd_bf_parameter_sets), 5), ]
#> mean_log sd_log skew_log log_likelihood
#> 5548 3.560829 0.3485909 0.6596345 -1093.725
#> 4063 3.567301 0.3424491 0.7452027 -1094.607
#> 5912 3.510238 0.3755722 0.6287780 -1093.949
#> 9707 3.520713 0.3742877 0.8409947 -1093.043
#> 3856 3.503952 0.3878848 0.7738284 -1094.364
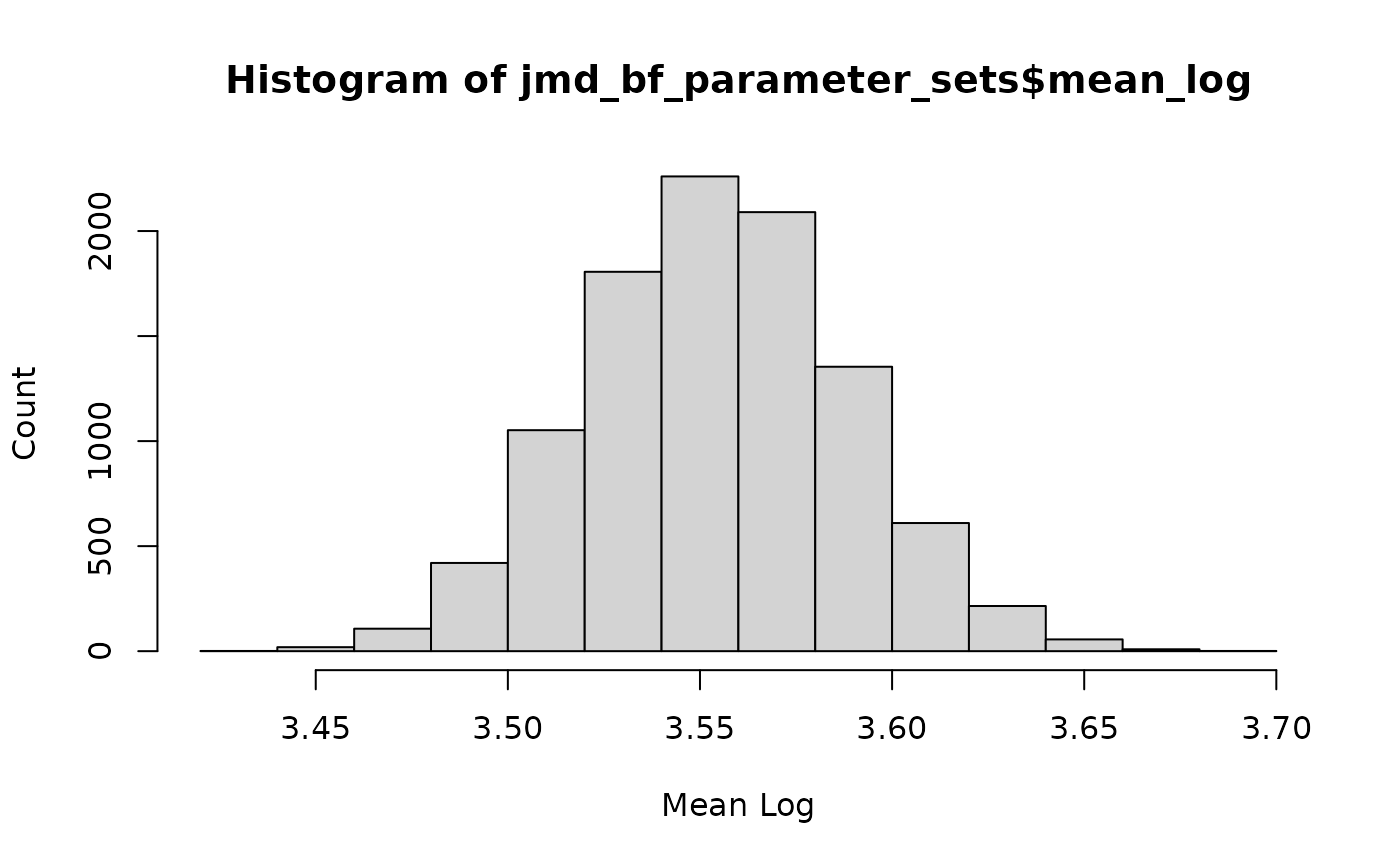
hist(jmd_bf_parameter_sets$mean_log,
xlab = "Mean Log", ylab = "Count")